A Procedure To Estimate Elevator Energy Consumption Using Traffic Simulation
Oct 1, 2024

Numerical examples show practical application.
by Janne Sorsa
This paper was presented at Elevcon 2023 in Prague, Czech Republic.
Key words: Elevator, energy consumption, simulation
Abstract
Current methods estimate the annual energy consumption of an elevator using simplifying modeling assumptions. The assumptions, however, may greatly differ from elevators operating in groups in high-rise buildings under complex traffic conditions and intensive use. For such cases, elevator traffic simulation provides an accurate method to evaluate energy consumption per typical day in operation. This article describes a procedure to first simulate a typical daily passenger demand profile and then to evaluate energy consumption from elevator trips occurring in simulation. In addition, numerical examples show how the procedure can be applied in practice to compare different elevator products.
1. Introduction
As the importance of sustainability in construction is constantly increasing, also the interest in estimating elevator energy consumption is growing. Environmental product declarations provide building designers and owners detailed information about energy consumption and carbon emissions during elevator life cycle but do not give comparable values for a specific building being designed (Scott, 2022). Different models for elevator energy consumption have been developed during the years without much consistency (Lorente Lafuente, 2013; Tukia, 2019; Peters R., 2022). However, ISO 25745-2, the standard on elevator energy performance, provides formulas to calculate elevator energy consumption (ISO, 2015). The modeling assumptions of the standard may represent low-rise residential buildings with sufficient accuracy but may differ greatly from the actual operation of elevators in commercial high-rise buildings, even if its forthcoming amendment will consider express zones (ISO, 2022).
Generally, elevator energy consumption is affected by elevator installation, the elevator control system and traffic in the building, which cannot be easily modeled by formulas (Siikonen, Sorsa & Hakala, 2010). A model for an elevator installation provides energy consumption values for specific hardware and can be of any complexity (Hakala, 1995; Smith, Peters & Al-Sharif, 2009). Less complex models may be sufficiently accurate for design purposes but more complex models, often supplier specific and not available for public domain, may describe the actual elevator product (Peters R., 2022). Elevator traffic simulation, on the other hand, is the right tool to model the effect of control systems and traffic (Siikonen, 1993; Peters R., 1998). Traffic simulation is nowadays routinely used in the planning and selection of passenger elevators, but the simulated traffic patterns concentrate on peak demands (ISO, 2020; CIBSE, 2020).
Modern traffic simulation tools, on the other hand, are also capable of simulating full-day demand profiles and analyzing energy consumption along with other statistics (Siikonen, Susi & Hakonen, 2001; Hakonen, Kuusinen & Sorsa, 2023; Peters Research Ltd., 2023). However, real-world data on full-day demands is still scarce, although some well-known demand profiles have been published (Strakosh, 1983; Siikonen, 2021; Peters, Smith & Evans, 2011). Furthermore, a large-scale study of passenger demands in different buildings requires an algorithmic approach in addition to new measurements (Sorsa & Laine, 2022).
Since traffic simulation models are integrated with real elevator control systems, they can be considered the most realistic way of anticipating elevator movements in a future building. If elevator movements in a full-day simulation are associated with the values of running energy per elevator trip and non-running energy during periods of inactivity, an accurate account for daily energy consumption can be produced. This paper aims to develop a procedure to estimate elevator energy consumption using traffic simulation that can be considered for the future editions of ISO 25475-2. The approach concentrates on new buildings, but the procedure can also be applied to measured energy consumption and traffic from an existing building (Tyni, Kontturi & Perälä, 2012; Batey & Kontturi, 2016).
The rest of the paper is organized as follows. Section 2 discusses the key terms on which the energy consumption analysis is based. Section 3 describes the simulation of full-day passenger demand profiles and defines simulation data describing elevator movements. In Section 4, formulas to calculate energy consumption from simulation data are derived. Section 5 presents numerical results, which compare simulation methods to the current standard.
2. Terminology
ISO 25745-2:2015 uses two terms to describe elevator operation: First, a trip consists of elevator movement from a starting landing to the next stopping landing not including re-leveling; second, a cycle includes an up and down trip, as well as two complete door cycles, during which the doors are opened, kept open and closed (ISO, 2015). On the other hand, the corresponding terms in the ISO 8100-32:2020 standard on the planning and selection of passenger elevators are flight and round trip (ISO, 2020). A round trip may contain more than two stops, and, in its generalized definition, may start from an arbitrary floor instead of the main entrance floor (Hakonen & Siikonen, 2009). Therefore, round trips are not a useful concept for calculating energy consumption from detailed simulation event data. Furthermore, an elevator may need to either open the closed doors again after standing idle on the landing, reopen the doors due to a landing call if allowed by the control system or keep the doors open for a period longer than typical due to passenger transfers or elevator parking. Due to these complexities, the following definitions are used throughout this paper:
A trip consists of elevator movement from a starting landing to the next stopping landing.
A cycle begins either when the car doors start to close or when the elevator becomes busy after being idle and ends when the car doors start to close again.
It is worth noticing that the definition allows cycles without any elevator movement. A full cycle contains all phases of door operation only once: opening, remaining open and closing. The time the car doors are kept open varies randomly depending on the number of passengers boarding and alighting the elevator. Furthermore, cycles starting from an idle state may contain two door openings, while a cycle ending at an idle state may contain only door closing.
3. Simulation of Daily Elevator Traffic
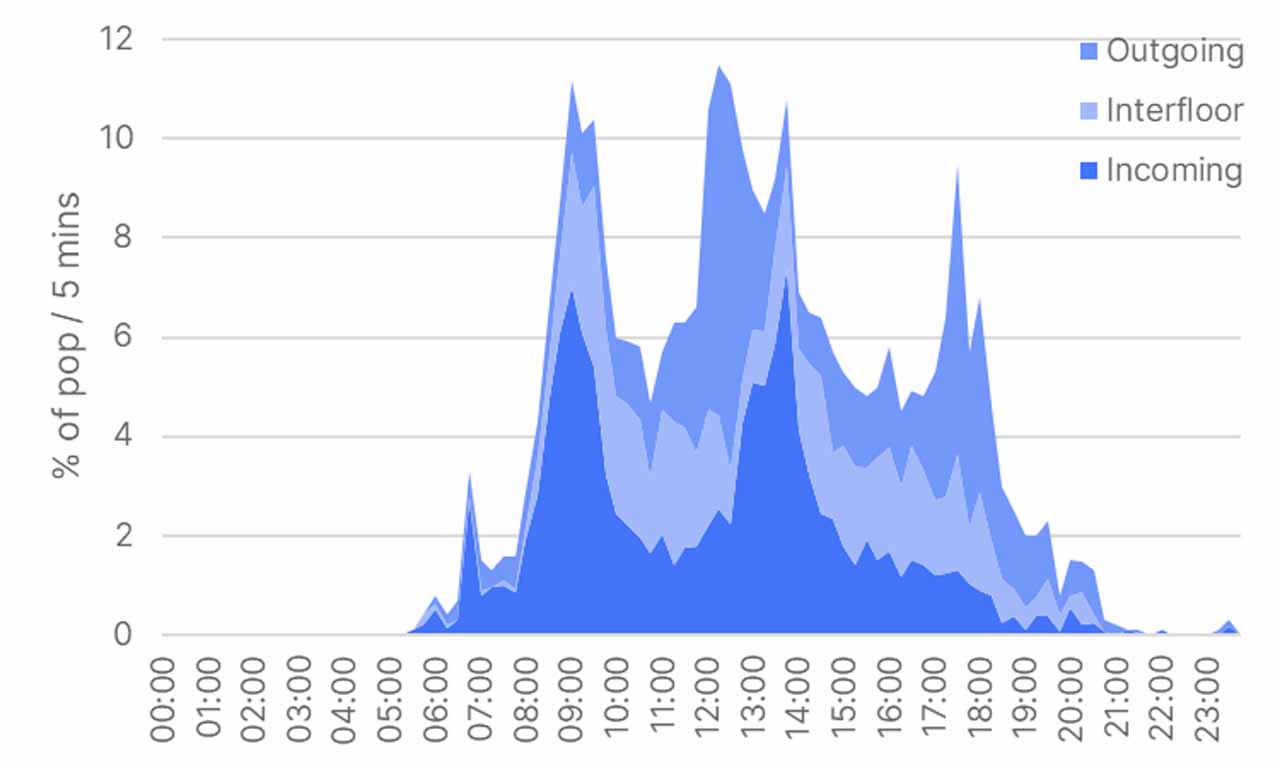
In an operational building, passenger demand and traffic mix vary throughout the day. Figure 1 shows incoming, outgoing and interfloor passenger demands for each 15-min period of the day stacked on top of each other, which have been measured in a multi-tenant office building. While in practice no passengers travel during the night, the ramp up of morning uppeak occurs before 7:00 and the tail of evening downpeak after 19:00. For an accurate estimate of both running and non-running energy consumption, such a 24-h demand profile needs to be simulated. If 24-h data is not available, a 12-h demand profile gives a good understanding of running energy consumption during the busy time of the day but misses a major part of non-running energy consumption during quiet time.
Simulation produces a wealth of data on elevator movements and states that can be used to calculate the consumption of running energy. Naturally, the data contains travel distance and flight time to travel that distance for each elevator cycle . In addition, simulation records the number of passengers per cycle, which yields percentage car load per cycle for a given rated load and mass per passenger . To estimate the consumption of non-running energy accurately, start and end time of a cycle, ) and , respectively, are recorded.
As discussed earlier, ISO 25745-2 includes the time for the opening, remaining open and closing of the doors at the landings in running time and running energy, which assumes a typical elevator movement from one floor to another. Simulation, however, models the operation of elevators and their control systems as close to real elevators as possible, which raises more possibilities for door operations. To align with ISO 25745-2, all door operations of a cycle are included in running time . Thus, door opening, opened and closing time are accumulated as they occur in simulation. In addition, each cycle is associated with non-running time , which consists of standing time in idle, standby after 5 min and standby after 30 min mode:
where
— the standing time during cycle i spent in idle mode, in standby after 5 min, in standby after 30 min, respectively.
In ISO 25745-2, the calculation of energy consumption is based on aggregate data whose values are given in tables for different building usage categories from very low to extremely high usage. The quantities used in ISO 25745-2 can be derived from simulated elevator cycles. In the case of an elevator group, the quantities may represent averages across all elevators or an individual elevator depending on the context.
The data is collected based on cycles but averaged across trips. The number of trips per day is deduced from simulation events by counting cycles during which an elevator moves. Then, average travel distance is simply:
Average percentage load %Q is also straightforward to calculate, but the details depend on the tool. Typically, simulators only model standard passengers with equal weight and space occupancy, but advanced tools can model the characteristics of individual passengers (Siikonen, Susi & Hakonen, 2001; Hakonen, Kuusinen & Sorsa 2023; Peters Research Ltd., 2023):
where
—the mass of the jth passenger.
Finally, the total running and non-running time per day , and , respectively, are summed over the cycles and given in hours:
The running time of a cycle is here defined by its start and end time from which non-running time is subtracted. Such a definition correctly considers random door events arising from passenger movements and elevator kinematics differing from the ideal (Peters R. D., 1995; Appleby, Peters & Deokar, 2022).
4. Calculation of Energy Consumption Using Simulation Data
To calculate energy consumption from simulated elevator cycles, the cycles need to be associated with their energy consumption values. Running energy of a cycle, comprises of elevator trip energy required to move the elevator from one landing to another, door energy needed to open and close the doors and energy consumed during passenger transfers (Lorente, Gómez, Diez & Arteche, 2010):
Elevator trip energy can be modeled through line power by considering required motor power to move the load, power losses, constant power consumed by the control panel and lighting, constant power consumed by the brake and fan and inverter losses (Hakala, 1995; Siikonen, Sorsa & Hakala, 2010). The loss components of elevator trip energy are always positive, but motor power may be negative in the case of a regenerative drive. Power consumption can also be approximated by modeling acceleration (deceleration) phase as linearly increasing (decreasing) straight line that start from (end at) the idle power (Peters R., 2022):
where
— the idle power and the full-speed power including idle power while moving,
— time to accelerate, run at full speed and decelerate.
Equation (9) does not consider the peak powers at the end of acceleration and deceleration phases. Thus, it is assumed that the underestimated power in the acceleration phase is mostly compensated by the overestimated power in the deceleration phase.
For simplicity, the power to move car doors, as well as the power consumed during passenger transfers, can be considered constants.
Non-running energy of a cycle, ,consists of constant power consumed in idle and standby modes:
where
– the idle power, the standby power used after 5 min, the standby power used after 30 min.
The total daily and annual energy consumption, and , respectively, can then be easily calculated along the lines of ISO 25745-2 by aggregating the energy consumption of all elevator cycles in the simulation:
where
— the daily running and non-running energy consumption,
— the number of operating days per year.
In addition to energy consumption, simulation data can be used to calculate a benchmarking energy performance indicator (So, Cheng, Suen & Leung, 2005; So, et al., 2022):
where
— the energy consumed per load per travel distance.
To avoid infinity in Equation (15), the nominator is assumed one if an elevator has not moved at all during the period over which the summation is taken (So, Cheng, Suen & Leung, 2005).
A smaller number of this energy performance indicator implies better energy efficiency: either less energy is consumed in transporting a particular number of passengers or more passengers are transported by consuming similar amounts of energy. It is also possible that an energy-aware control system transports more passengers with less energy than a standard full collective control system (Glad, Kokkala, Ruokokoski, Sorsa & Tukia, 2022).
When accumulating statistics for a particular period of the day, some challenges arise especially from the quiet time of the day. First, each cycle needs to be associated with, say, a 15-min period, which could be based either on cycle start or end time. If an elevator stands idle for hours before it starts to move, the corresponding cycle extends to multiple periods. In such cycles, the consumption of running energy occurs close to the end of a cycle. Therefore, the period to which running energy is reported is determined from cycle end time, but the non-running energy consumption is divided between all the periods that the cycle covers. Otherwise, the period during which the movement occurs would also show a high peak of non-running energy accumulated from the beginning of the cycle.
Second, only some elevators of a group may move during a period within the quiet time. To represent an average elevator making an average number of trips per day, running and non-running energy can be averaged across all elevators in the usual manner. When averaging the energy consumed per load and per travel distance, elevators that have not moved at all during a period, however, need be filtered out since their energy per load and per travel distance tends to infinity, while an average elevator, which has transported some load, should have a finite energy performance value.
5. Daily Energy Consumption in a Multi-Tenant Office
The developed procedure to use elevator traffic simulation to estimate elevator consumption is studied with an elevator group consisting of four elevators controlled by a typical full collective control. The group serves 12 populated floors with a population of 50 persons above eight express floors and an entrance floor. The floor heights in the building are equal, 3.25 m between all floors, which yields the total travel distance of 65 m. The elevators have a rated load of 1000 kg and are assumed to load up to 10 passengers. Rated speed of the elevators is 2.5 m/s while acceleration and jerk are 0.8 m/s2 and 1.1 m/s3, respectively. With these parameters, the handling capacity of the group becomes 12% of population per 5 min and average uppeak interval 33.6 s. The elevators are typical modern high-rise elevators with permanent magnet motors and regenerative drives. Furthermore, the elevators can enter standby mode after five minutes of inactivity.
Energy consumption for the case study elevator is calculated by using ISO 25745-2 formulas, as well as by simulating the demand profile depicted in Figure 1. The first edition of the standard, ISO 25745-2:2015, is referenced as ISO 2015 in the following, while its first amendment considering express zones is referenced as ISO 2022 (ISO, 2015; ISO, 2022). Furthermore, ISO 2022 is used in a non-standard way where the number of trips per day, average travel distance, average car load, the time for the opening, remaining open and closing of the elevator doors, as well as time ratios in idle and standby modes, are derived from simulation data. In that case, usage category is denoted as custom. When averaging the times for the opening, remaining open and closing of the elevator doors, all occurrences are first summed up and then divided by the number of trips to take correctly into account door operations related to a trip that may be split among two cycles. The results are shown in Table 1, where simulation results refer to averages across all elevators.
The main difference between the simulation and the ISO method is clearly visible in the number of trips, which is an input to the ISO formulas but a result from simulation. Therefore, it does not come as a surprise that the simulation result, about 1,850 trips, falls between ISO usage categories 5 and 6 but is closer to category 5 than category 6. The significant differences that can be observed not only in inputs but also in the results just point out the impossibility of finding a model and its parameters that accurately model the operation of all elevator products under all circumstances. It is also worth noticing that the new amendment ISO 25475-2 underestimates the simulated average travel distance by 6.5%, while the first edition overestimates it by 9.5%.
ISO 2015 underestimates running energy by about 15%, while ISO 2022 by about 20% compared to the simulation result. This difference is at least partly explained by the estimated running time, which is about 15% less in the ISO method than in the simulation results. However, even if the ISO 2022 method is used with custom inputs from simulation, the calculated running energy still falls more than 10% below the simulation result. This difference is most likely explained by the energy model of the standard, where energy consumption is derived from the reference cycle. In such a full shaft trip, the efficiency of a motor is at its maximum, but, in practice, elevators make more short trips where efficiency is not so high. Nevertheless, elevator traffic simulation accompanied with a detailed energy consumption model accurately models all kinds of effects.
Efficiency of energy use to transport passengers can be measured by the specific running energy for the average running cycle as described in the standard and by the total energy consumption per transported load per traveled distance. The values of energy consumption per load per travel distance are about 10 times higher compared to the specific running energy, which can be explained by the consideration of non-running energy and transported loads. Energy per load per travel distance based on the ISO methods are 15-20% higher than the simulation results. In other words, the ISO calculation assumes rather inefficient transportation of passengers. If simulation data is used as the input for the ISO 2022 method, energy efficiency seems better than in the simulation, which apparently arises from the underestimated energy consumption. All in all, energy per load per travel distance can be used to benchmark the energy efficiency of an elevator installation.
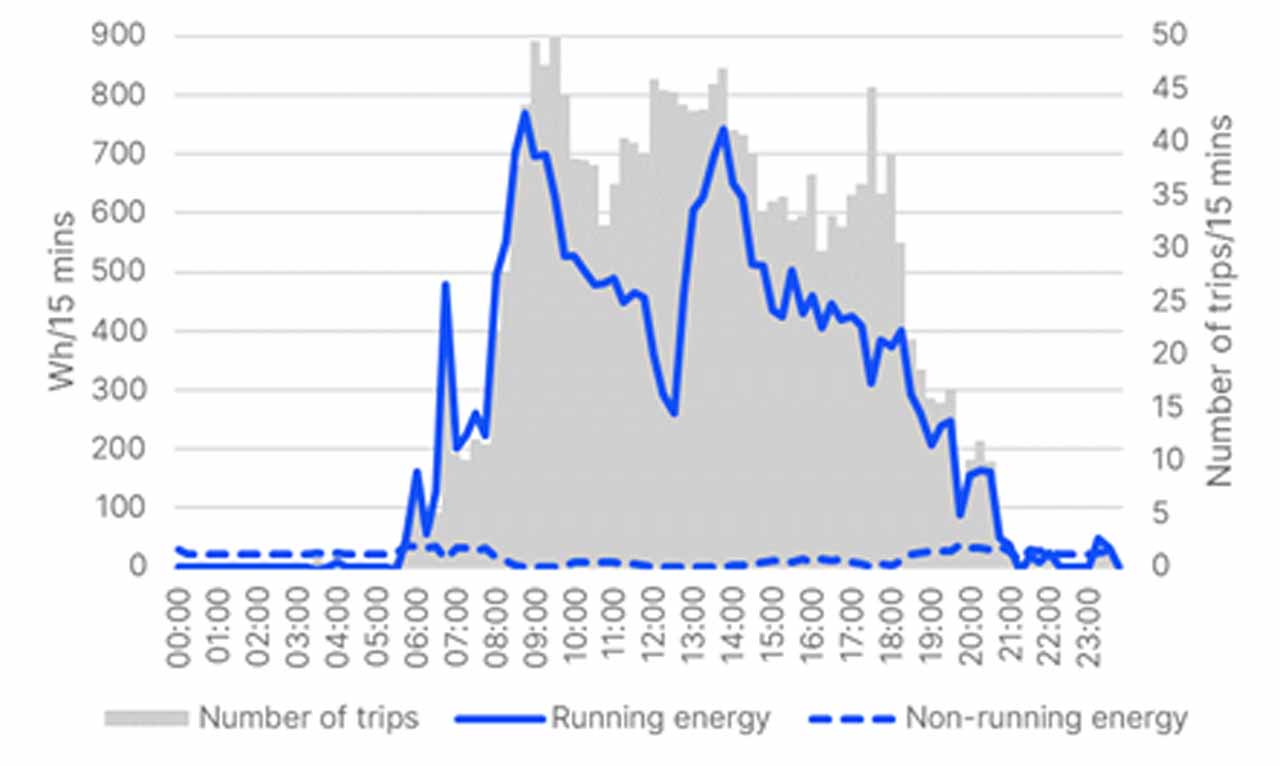
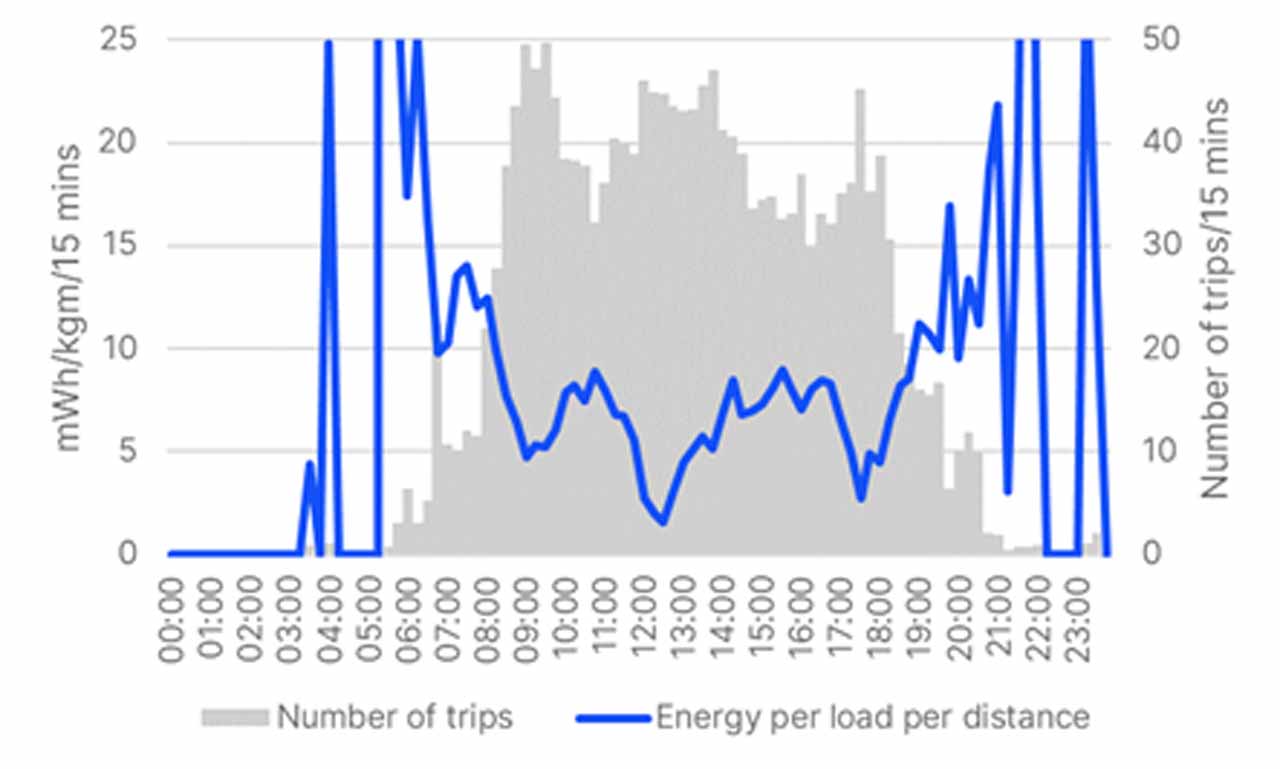
Figure 2 shows energy consumption on the top along with the number of trips throughout the day in 15-min periods. Energy consumption is split into running energy and non-running energy. As can be expected, running energy dominates during office hours and significant amounts of non-running energy are consumed during quiet times. In general, peaks in running energy follow the peaks in the number of cycles. However, during downpeak periods where more than 50% of the demand is outgoing traffic, say, just after the midday and around 17:30, running energy consumption is relatively small compared to the number of trips since elevators are regenerating efficiently when traveling downwards quite fully loaded and upwards quite empty.
On the bottom, Figure 2 describes the energy efficiency of an average elevator throughout the day in 15-min periods. During quiet times, efficiency is naturally very poor and energy per load per travel distance values are out of reasonable bounds. During peak times, energy efficiency is relatively good even if the number of cycles is high due to the high number of passengers being transported. The low energy consumption (high regeneration) during downpeaks is also visible in energy efficiency since energy per load per travel distance reaches very low values for short periods.
6. Conclusion
In this paper, a procedure to estimate elevator energy consumption using traffic simulation was introduced. The procedure provides both running and non-running energy consumption per day for an elevator group by combining elevator energy usage to the elevator trips occurring during a simulation of full-day passenger demands. The procedure accurately takes into account the elevator installation, traffic in the building and the effect of the control system. On the other hand, the current ISO 25745-2 standard on elevator energy performance provides formulas based on average elevator usage to calculate energy consumption of a single elevator per day. According to a case study, the standard underestimates energy consumption by more than 15% compared to the simulation results, which is partly explained by input parameters, such as the number of trips per day, and partly by the energy consumption derived from the reference cycle. Therefore, the standard should be amended with the proposed method to calculate elevator energy consumption and benchmarking energy performance indicator in the future.
Acknowledgements
The author would like to thank Dr. Richard Peters, Dr. Toni Tukia and Henri Hakonen for their insightful comments and support.
References
[1] Appleby, M., Peters, R. & Deokar, N. (2022). Generation and Application of Dynamic Lift Kinematics. Proceedings of the 13th Symposium on Lift and Escalator Symposium. Northampton.
[2] Batey, D., & Kontturi, M. (2016). Traffic analysis for high rise buildings to be modernized. Elevator Technology 21 (pp. 26-35). IAEE.
[3] CIBSE. (2020). CIBSE Guide D: 2020 – Transportation Systems in Buildings. CIBSE.
[4] Glad, A., Kokkala, J., Ruokokoski, M., Sorsa, J. & Tukia, T. (2022). Reducing energy consumption by an optimization algorithm in elevator group control. Proceedings of the International Elevator & Escalator Symposium. Barcelona.
[5] Hakala, H. (1995). Applications of Linear Motors in Elevator Hoisting Machines. Tampere University of Technology, Publications 157, Doctorate Thesis.
[6] Hakonen, H., & Siikonen, M.-L. (2009). Elevator traffic simulation procedure. ELEVATOR WORLD, 57(9), 180-190.
[7] Hakonen, H., Kuusinen, J.-M. & Sorsa, J. (2023). Simulation Based Design of Transportation Systems in Buildings. Elevator Technology 23. IAEE.
[8] ISO. (2015). ISO 25745-2:2015 – Energy performance of lifts, escalators and moving walks — Part 2: Energy calculation and classification for lifts (elevators). Switzerland: International Organization for Standardization.
[9] ISO. (2020). ISO 8100-32:2020 – Lifts for the transportation of persons and goods — Part 32: Planning and selection of passenger lifts to be installed in office, hotel and residential buildings. Switzerland: International Organization for Standardization.
[10] ISO. (2022). ISO 25745-2:2015/DAmd 1 – Energy performance of lifts, escalators and moving walks — Part 2: Energy calculation and classification for lifts (elevators) — Amendment 1: Express zones. Switzerland: International Organization for Standardization.
[11] Lorente Lafuente, A. (2013). Life Cycle Analysis and Energy Modelling of Lifts. University of Zaragoza, PhD thesis.
[12] Lorente, A. M., Gómez, A., Diez, D. & Arteche, F. (2010). State of the Art of Calculation Methods for Elevator Energy Consumption. Elevator Technology 18 (pp. 225-237). IAEE.
[13] Peters Research Ltd. (2023). Elevate Traffic Analysis and Simulation Software. Retrieved from peters-research.com
[14] Peters, R. (1998). Simulation for control system design and traffic analysis. Elevator Technology 9 (pp. 226-235). IAEE.
[15] Peters, R. (2022). Lift Energy Modelling for Green Building Design. Proceedings of the 13th Symposium on Lift and Escalator Technologies. Northampton.
[16] Peters, R. D. (1995). Ideal Lift Kinematics. Elevator Technology 6. IAEE.
[17] Peters, R., Smith, R., & Evans, E. (2011). The appraisal of lift passenger demand in modern office buildings. Building Services Engineering Research and Technology, 32(2), 159-170.
[18] Scott, A. J. (2022). Energy Efficient Buildings – Assessing the Impacts of Lifts. Proceedings of the 13th Symposium on Lift and Escalator Technologies. Northampton.
[19] Siikonen, M.-L. (1993). Elevator traffic simulation. Simulation, 61(4), 257-267.
[20] Siikonen, M.-L. (2021). People Flow in Buildings. Wiley-Blackwell.
[21] Siikonen, M.-L., Sorsa, J. & Hakala, H. (2010). Impact of traffic on annual elevator energy consumption. Elevator Technology 18 (pp. 344-353). IAEE.
[22] Siikonen, M.-L., Susi, T. & Hakonen, H. (2001). Passenger Traffic Flow Simulation In Tall Buildings. EW, 49(8), 117-123.
[23] Smith, R., Peters, R. & Al-Sharif, L. (2009). Method and apparatus to prevent or minimize the entrapment of passengers in elevators during a power failure. Patent No. US7540356B2. United States of America.
[24] So, A., Cheng, G., Suen, W. & Leung, A. (2005). Elevator Performance Evaluation in Two Numbers. EW, 53(1), 102-105.
[25] So, A., Lam, K., Kong, C., Chan, J., Wong, J. & Lau, D. (2022). Development of a Benchmarking Energy Performance Indicator (BEPI) monitor for existing traction lift systems. Energy & Buildings, 268, 112220.
[26] Sorsa, J., & Laine, T. (2022). New evidence on lift passenger demand in high-rise office buildings. Proceedings of the 13th Symposium on Lift and Escalator Technologies. Northampton.
[27] Strakosh, G. R. (1983). Vertical Transportation: Elevators and Escalators, 2nd Edition. New York: John Wiley.
[28] Tukia, T. (2019). Models for Evaluating the Power Consumption of Elevators. Doctoral dissertations 99/2019. Aalto University.
[29] Tyni, T., Kontturi, R. & Perälä, P. (2012). Electric Site Survey – on Quest of Elevator Parameters. Elevator Technology 19 (pp. 106-116). IAEE.
Get more of Elevator World. Sign up for our free e-newsletter.
![]()


![]()