Draka’s E3 Pays Off
Apr 1, 2014
How a Rocky Mount, North Carolina, plant created a leaner, greener factory.
For a Draka Elevator plant in Rocky Mount, North Carolina, a focused effort by employees and consultants resulted in lower costs, energy savings and a tangible return on investment. When Draka, a division of Prysmian Group that produces elevator products used in some of the world’s tallest structures, embarked on the endeavor, the North Carolina plant had been turning out quality elevator cable and related products for more than 40 years. But even the oldest, most experienced dogs must learn new tricks to adapt to changing times. In finding ways to run its factory more efficiently, Draka made more than a few changes to reduce both carbon emissions and overall environmental impact. The plant found that using less power, improving recycling habits and tweaking infrastructure led to lower overhead and cost reductions.
In finding ways to run its factory more efficiently, Draka made more than a few changes to reduce both carbon emissions and overall environmental impact
Facilitated in North Carolina by North Carolina State University’s (NCSU) Industrial Extension Service (IES), E3 (economy, energy and environment) is a federal initiative designed to help communities, manufacturers and manufacturing supply chains adapt and thrive in today’s green economy. For Draka, participation resulted in a win-win. Draka’s Director of Operations Bill Fassnacht, who learned about the program at a 2012 luncheon at which an NCSU IES representative spoke, elaborated:
“The steps we were able to take in cost reduction and addressing environmentally friendly practices were huge – so huge that a few months after completion, Draka won a major award for sustainability from a major manufacturer.”
Engineer Dustin Jones, who was tapped to help implement the initiative at the Draka plant, pointed out E3 “is a lot more than going through the dumpster and seeing what you can recycle.” Rather, he said, it brings together every facet of the manufacturing process: machinery, energy consumption, recycling, communication and safety. In addition, he said, it brings in outside observers to provide a fresh look at the status quo and identify where processes can be improved. It has five steps, which follow.
Energy Assessment
Energy assessment establishes a baseline for power and natural gas consumption, along with associated costs. Like many industrial facilities, Draka pays different rates for electrical power, depending on the time of day it is used. The assessment looked for ways the plant could reduce power consumption, such as by using power during off-peak hours and generating its own electricity. It then weighed these options against implementation costs.
Some recommendations were intuitive, such as recharging forklift batteries only during off-peak hours and replacing metal-halide lights with fluorescent lamps that use less power but produce the same amount of light. Others involved added infrastructure, such as a 100-kW generator to produce electricity formerly obtained from the local utility provider during peak hours.
Air compressors, a major component in the cable-manufacturing process, were found to generate heat that could be routed to the factory floor, in turn easing demand on heating units. Further, simply repairing leaks in compressed-air lines produced immediate savings, and replacing compressed air with blowers reduced energy use.
Business Excellence Analysis
Business excellence analysis identifies an organization’s strengths and weaknesses. The E3 team found that Draka’s strengths were an intensely customer-oriented approach to business and a clean, safe work environment. However, opportunities were found in management/employee communication. Information generally flowed from the top down, with limited opportunity for feedback from the factory floor. Changes were made so that communication took place in smaller groups, with every effort made to get essential input. The staff was also brought up to speed on Draka products and services beyond cable manufacturing. It was known that an involved employee is a more committed employee. So, new tools were developed that improved employee engagement.Solid-waste disposal was also identified as an opportunity. It was found there were missed opportunities to recycle instead of dispose of waste.
Lean, Green and Clean
The analysis led to a lean, green and clean assessment with the goal of a more streamlined and less costly manufacturing process with improved control of raw materials and scrap. While “green” identifies waste-management and recycling opportunities, Draka added “clean” to emphasize safety initiatives, making its third step “lean, green and clean” (LG&C). The assessment started with a thorough value-stream mapping of the cable-manufacturing process, from seeing how raw materials were handled to checking dumpsters for recyclables. A team of nine employees oversaw the process and returned with 80 potential areas for improvement, which were entered into a spreadsheet.
Waste-stream examination encompassed everything from studying waste-disposal bills to dumpster diving.
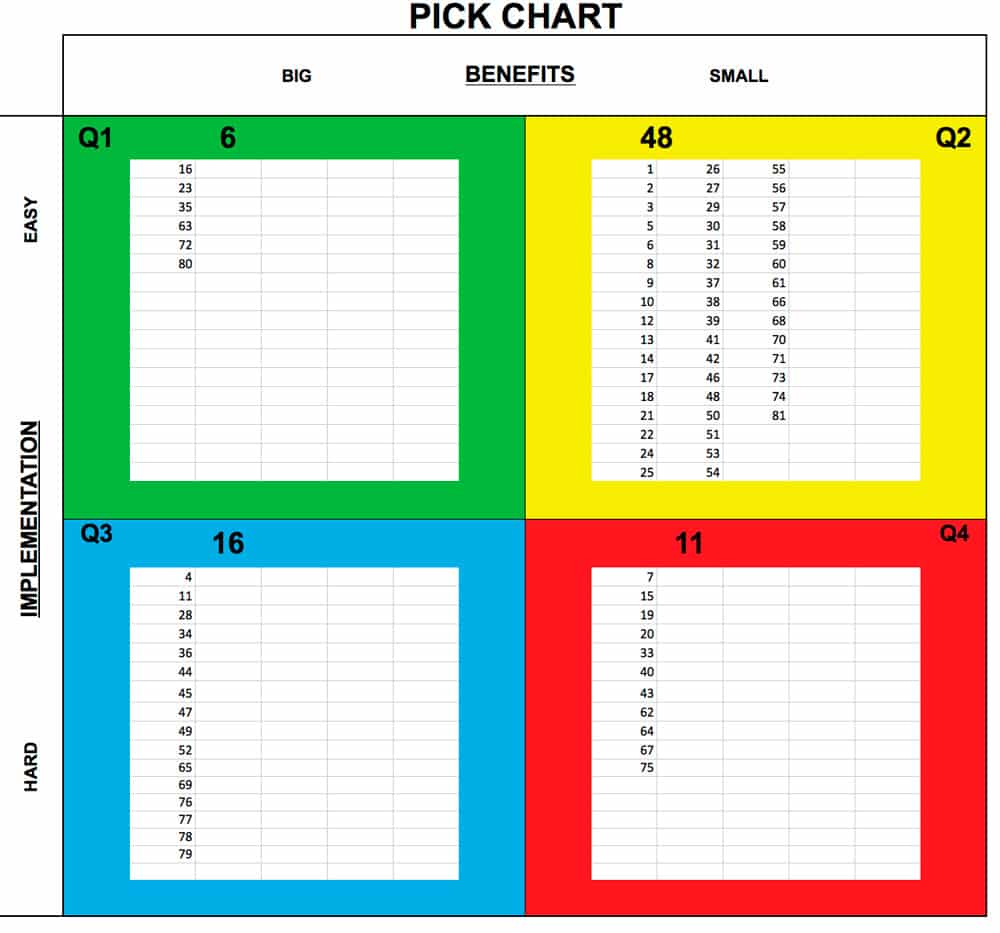
Improvements were arranged by benefits (from large to small) and implementation (from hard to easy), making them easier to prioritize. Easily fixed problems yielding greater benefits were placed in the upper-left “green” corner and addressed first. For instance, using shadow boards for tool-storage walls and drawers increased efficiency by approximately 4%, as well as enhanced safety. With a shadow-board system, any missing or misplaced tools are immediately apparent. Additionally, communicating to operators not to scrap but continue to use partially consumed spindles of jute (a cushioning component in traveling cable) could result in a four-figure reduction in material costs.
Easily achieved items that returned smaller benefits, such as replacing or repairing pipe insulation, were placed in the upper-right “yellow” quadrant of the matrix. Harder-to-achieve items that promised big benefits, like preventing breakage in the rayon fiber used to create the jacket sock, were placed in the lower-left “blue” quadrant. Hardest-to-achieve items that would take extensive time and effort were placed in the lower-right “red” quadrant. These might include making workspaces or opening up tight workspaces (a safety concern) by moving production machinery.
Of the 80 items found during the value-stream mapping, 23 were identified as lean, 18 as green, and 39 as clean related. Once prioritized, the 80 points were entered back into the LC&G spreadsheet and prioritized by benefit/implementation for return. Timelines were established, and the costs/savings, both tangible and intangible, were estimated.
Action
A Sort, Straighten, Shine, Standardize and Sustain (5S) team was appointed to oversee improvements and assign resources, not only to make them happen, but also to ensure they continue through education, communication and an environment of perpetual improvement. The LG&C improvement items came under special scrutiny as they offered the greatest potential for return on investment. The plan was to establish a baseline of how much material was being produced and recycled, collect data on this waste stream, determine what more could be recycled, find partners to dispose of waste less expensively and recover more usable material.
The plan was to establish a baseline of how much material was being produced and recycled, collect data on this waste stream, determine what more could be recycled, find partners to dispose of waste less expensively and recover more usable material.
Draka determined the plant produced 527 T. of production waste annually (84% of it recycled), 330 T. of general waste (7% of it recycled) and 120 T. of metals (all recycled). Waste-stream examination encompassed everything from studying waste-disposal bills to dumpster diving.
Results
By finding better waste-disposal partners, recovery of production waste such as scrap cable, went from 84% to 100%. Percentage of general waste, such as paper, bottles, cans, pallets and reels, rose from 7% to 31%, with income realized for paper, cans and bottles. Formerly, pallet disposal was an expense, with the company paying for trash-container rental, hauling and disposal on a per-ton basis. Now, Draka loads an onsite trailer with used pallets picked up by a recycler that rebuilds or mulches the pallet, all at zero cost to Draka. And, while 100% of metals were already being recycled, a new supplier was able to give Draka a better deal. The result was a US$20,000 reduction in waste removal and recycling costs and generation of US$15,000 in recycling profit.
Carbon Footprint Analysis
Carbon footprint analysis consists of the IES team using a computerized tool to calculate greenhouse-gas (GHG) output from a baseline of 2008. With the plans mentioned above, the plant lowered its GHG emissions 13%, from 3,324 T. in 2008 to 2,897 T. in 2012.
“If you stick to it, the rewards are tangible. This isn’t tree-hugger stuff. This is real and positive change that makes better products, reduces waste and makes the plant a safer place.”– Engineer Dustin Jones
Work and Safety Assessment
Work and safety assessment by the U.S. Department of Labor measured safe practices. Noted Fassnacht: “Our maintenance staff jumped on every single observation and made changes within a month. It’s one example of how all our employees really embraced [E3].”
Jones added, “If you stick to it, the rewards are tangible. This isn’t tree-hugger stuff. This is real and positive change that makes better products, reduces waste and makes the plant a better work environment.”
Get more of Elevator World. Sign up for our free e-newsletter.
