Elevator Traffic-Flow Prediction Based on Monte Carlo Method
May 1, 2012

This article provides several equations pertaining to traffic flow.
by Wang Sheng, Yao Lianghong, Luo Zhiqun and Wan Jianru
Elevator traffic flow is fundamental in reasonable elevator configuration. The passenger-flow data per day can be predicted by forecasting five kinds of typical traffic patterns. Elevator traffic-flow prediction based on the Monte Carlo method describes the behavior of passengers, including arrival time, original floor and destination floor. The roulette model is fit for traffic-flow prediction. The traffic-flow data based on this model shows the model is feasible. By calculating the cumulative probability value, it can decrease the error value, which improves the prediction accuracy. Simulation also shows the improved elevator traffic-flow prediction based on Monte Carlo is more accurate than the traditional method.
Introduction
With the rapid development of buildings, high rises and ultra high rises have been erected around the world. Unreasonable elevator configuration leads to a waste of building area, crowded staff and a waste of time. Elevator traffic-flow analysis should be a prerequisite for elevator configuration. Accurate traffic-flow prediction should play an important role in elevator configuration.
The behavior of passengers taking the elevator includes three elements: arrival time, original floor and destination floor. This behavior is divided into three modes: upward, downward and interfloor passenger flow. The traffic flow in a day is divided into five typical traffic patterns: up-peak, down-peak, lunchtime, conventional and off-peak. We can get one day’s traffic-flow data by forecasting these five typical traffic patterns.
Zhifeng Pan and Fei Luo[1] presented an elevator traffic-flow model based on dynamic passenger distribution and a traditional elevator traffic-flow prediction based on Monte Carlo. This paper explains a new elevator traffic-flow prediction based on a roulette model. Through calculating the cumulative probability value, an improved elevator traffic-flow prediction is also presented.
Traditional Elevator Traffic-Flow Prediction Based on Monte Carlo
Traffic flow is related to the nature of building construction. Office buildings are the object of this paper. Passenger arrivals are random events and, as such, are assumed to Poisson distribution. Passenger arrival time is as follows:
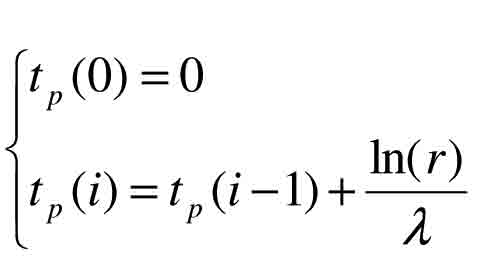
where tp(i) is the arrival time of the ith passenger, r is random data between 0 and 1, and l is the rate of passenger arrivals.
It is also a random event for passengers to come from one floor and go to another. Two related parameters must be introduced, including the O vector (ratio vector of floor of passenger origin) and OD matrix (ratio matrix of floors of passenger origin and destination). O vector can be determined as follows:
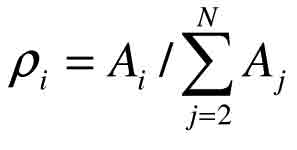

where Ai denotes the passenger distribution capability of the ith floor, N is the floor number, Oi is the ith data of ratio vector of floor of passenger origin, s1 is the percentage of passengers coming into the lobby, s2 is the percentage of passengers departing from the lobby and s3 is the percentage of resting passengers.
Similarly, OD matrix can be gained as follows:
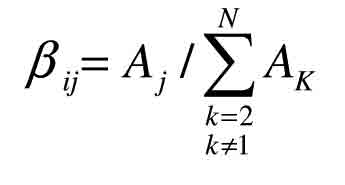


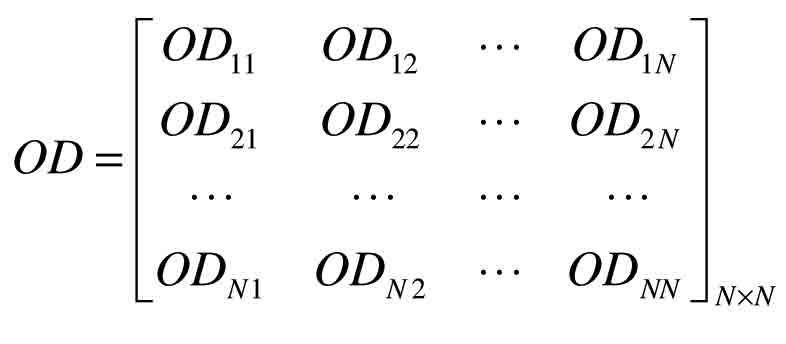
Construct a roulette with n interval, which corresponds to the n floor in turn along the circumference. The area of each interval is proportional to the original density to the floor as the starting layer. Turn the roulette to generate a random original floor for each passenger. The destination floor can be determined according to the OD matrix. The method is similar to the method used to determine the original floor. For every passenger, it determines the original floor i, then constructs a roulette with n-1 interval, which corresponds to the n-1 floor (except the bottom floor) in turn along the circumference. The area of each interval is proportional to the elements in the ith line of the OD matrix. As before, turn the roulette to randomly assign each passenger a destination floor.
We then multiply the random number and origin probability density function to get their maximum, which is the original floor. The same method is used to determine the destination floor.
Improved Elevator Traffic-Flow Prediction Based on Monte Carlo
Passenger arrival time is also worked out by the Poisson distribution function. Computer simulation strength is increased on this basis. Calculating the average multiple times can improve the prediction accuracy. The passenger flow to and from the ith floor is proportional to the resident population of the ith floor. x, y and z represent the percentage of upward passenger flow, percentage of downward passenger flow and percentage of interfloor passenger flow, respectively. They are also separately equal to the number of upward passengers, downward passengers and interfloor passengers, divided by the total number of the building. Their sum is one.
To determine the original and destination floors, two new parameters must be introduced, including the “Origin” density vector and “Origin/Destination” matrix. The former can be gained as follows:

where Origin(i) is the relative passenger flow from the ith floor. The values of x, y and z are determined by the traffic pattern.
The cumulative density for every floor is calculated as follows:

lji is the cumulative density for the ith floor, and N is the floor number.
After calculating the cumulative density, random data w between 0 and 1 is produced. This follows even distribution. If w<lj1, the first floor is the original one for this passenger. If lji-1 <w< lji,the ith floor is the original floor.
After calculating the original floor, it is also necessary to calculate the cumulative density for every floor to get the destination floor. First, all the elements in i line (except those in which the destination floor is the ith floor) are added. The result is sumi. Then, pij = od(i,j)/sumi. pij is the density when the jth floor is the destination floor. The cumulative density for every floor is calculated as follows:

This produces a random data w2 between 0 and 1 as above. If w2<lj2i1, the first floor is the original floor. If lj2i,j < w2< lj2i,j-1, the jth floor is the original floor.
Simulation and Analysis
Based on the two elevator traffic-flow prediction methods, the simulation is designed in VB and Matlab. We use simulation to prove the feasibility of prediction methods. The building is an office building with 20 floors, with floor heights of 3 m. The passenger distribution capability of every floor is the actual value of a building in Tianjin, China. The value of each floor is 14, 71, 149, 101, 74, 61, 86, 69, 51, 69, 89, 61, 89, 51, 39, 31, 29, 26, 24 and 21, respectively.
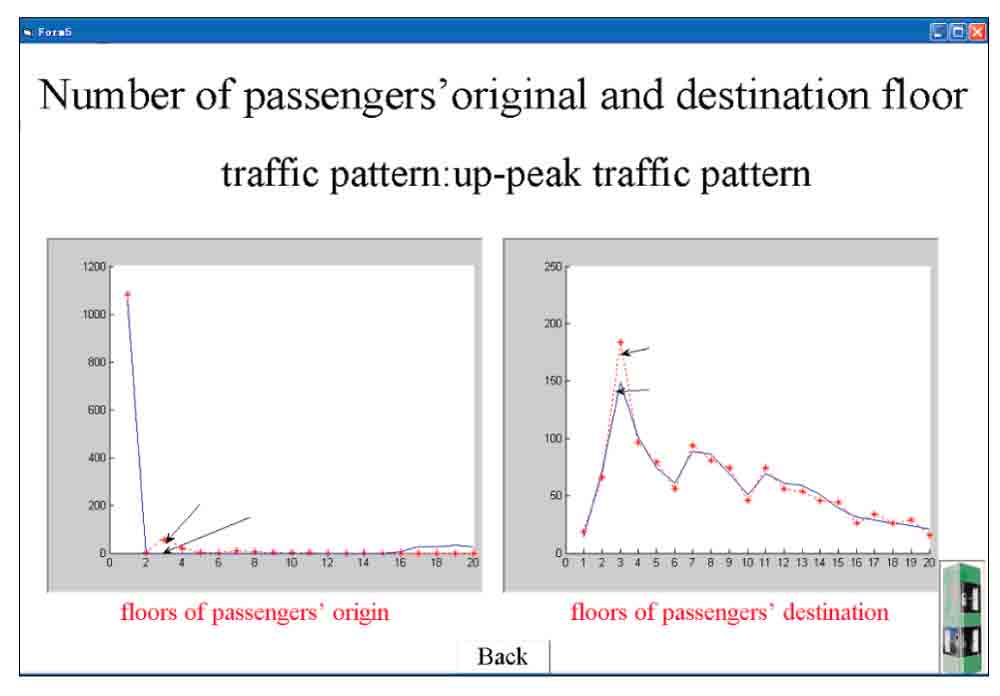
First, choose the up-peak traffic pattern. Passenger behavior by ladder can be displayed in the interfaces. The prediction result of original and destination floors is shown below.
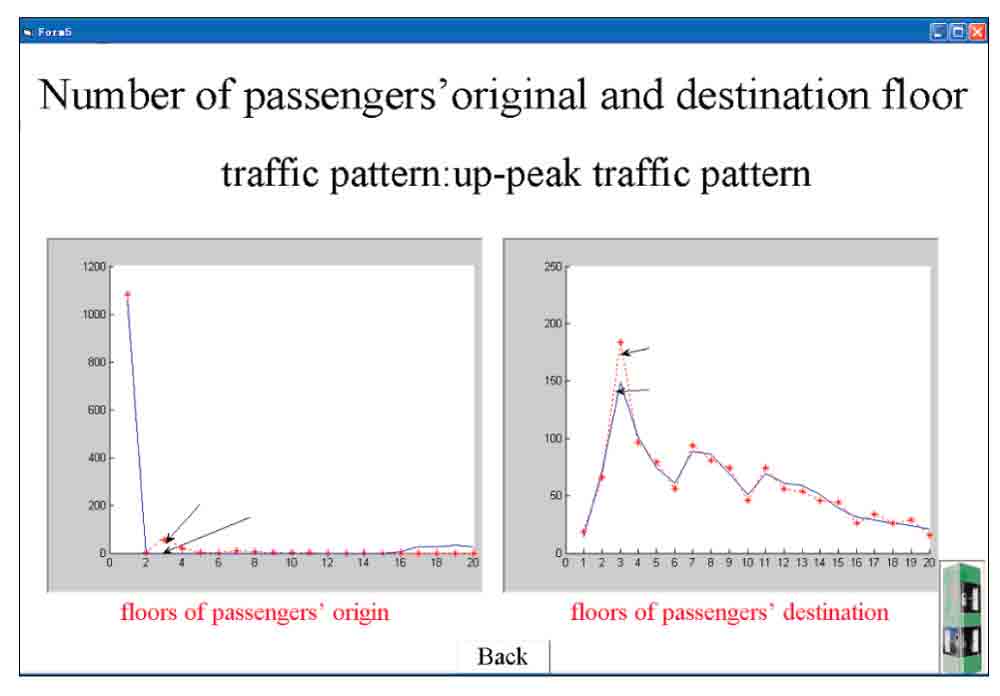
Figure 1 indicates most persons come into the buildings from the first floor. The destination floor number is similar to the distribution capability of every floor, while the second method is more accurate than the first.
By analyzing the result and interface in Figure 2, we find that the percentage of upward passengers with the first method is 93.7%, and that figure with the second method is 90.13%. The target of percentage of upward passengers is 90%. The error value is 3.7% and 0.13%. The percentage of downward passengers is 2.3% and 4.57%, respectively, and the target of percentage of downward passengers is 5%. For the percentage of interfloor passengers, it is 0.9% in the first method and 5.4% in the second method. The target of percentage of interfloor passenger is 5%. Through this analysis above, it is obvious the second method is more accurate than the first.
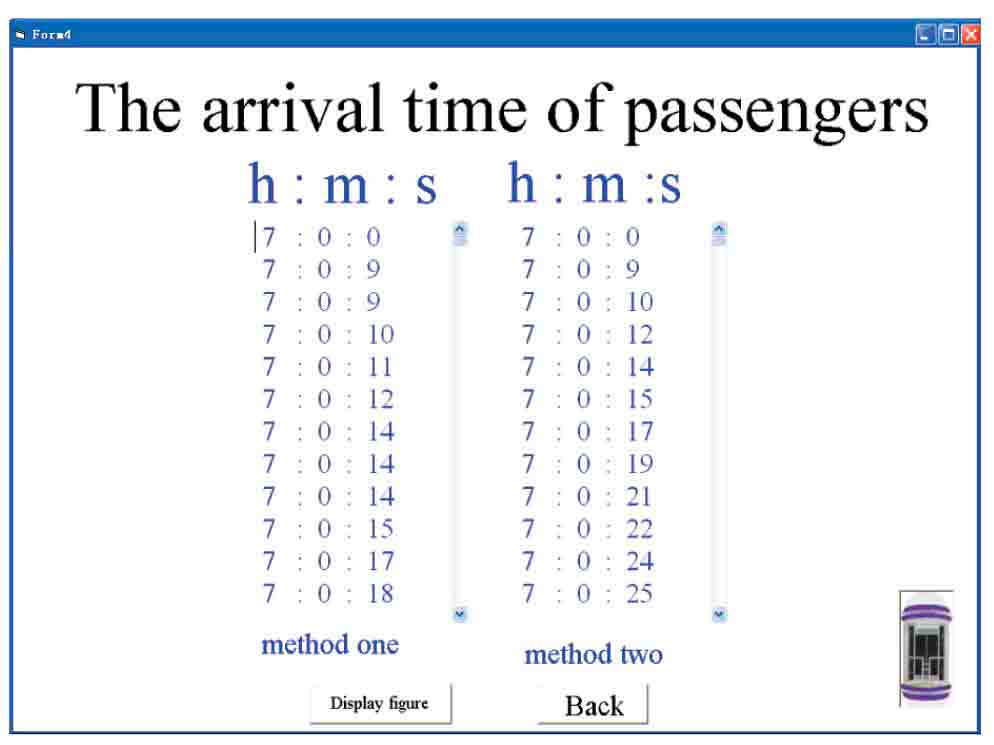
By looking at Figure 3, we can find that people begin to appear from seven, compatible with real-world conditions. The other analysis of the interface in other traffic patterns is shown in Figure 4. Here, we used the same analytical method to analyze the result. The improved elevator traffic-flow prediction based on Monte Carlo can greatly increase the prediction accuracy. This is because the second method calculates the cumulative probability value to decrease the error value.
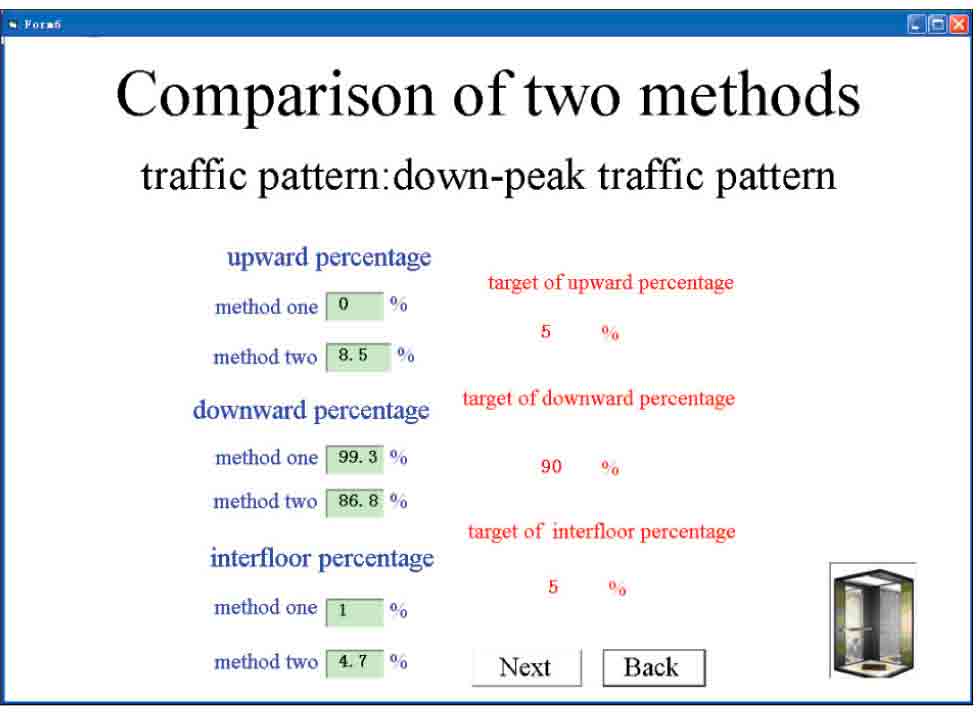
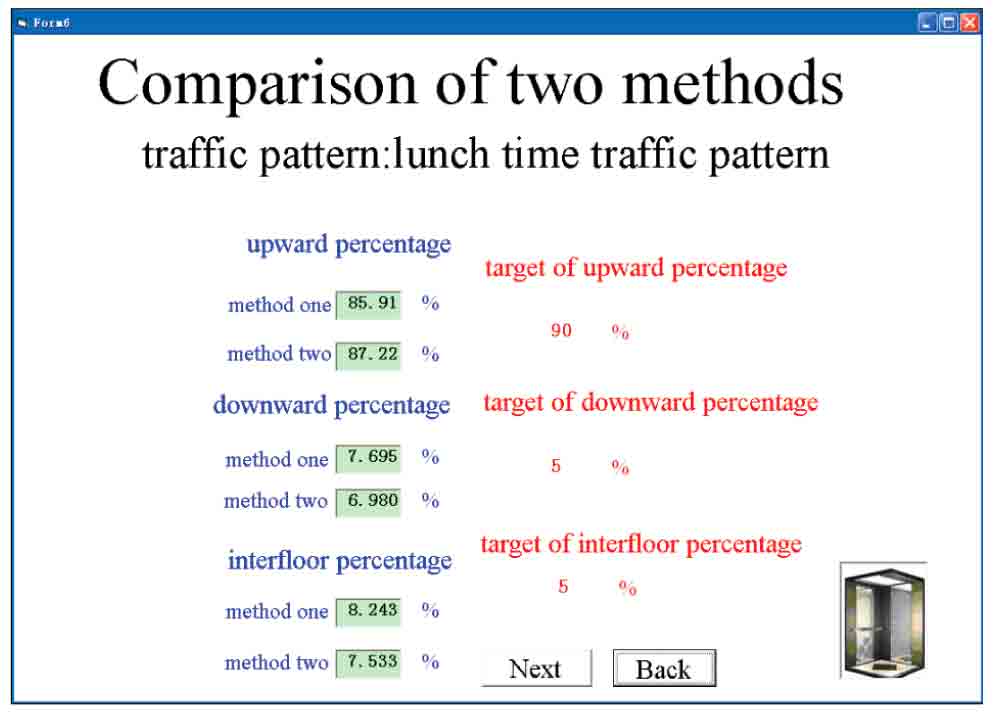
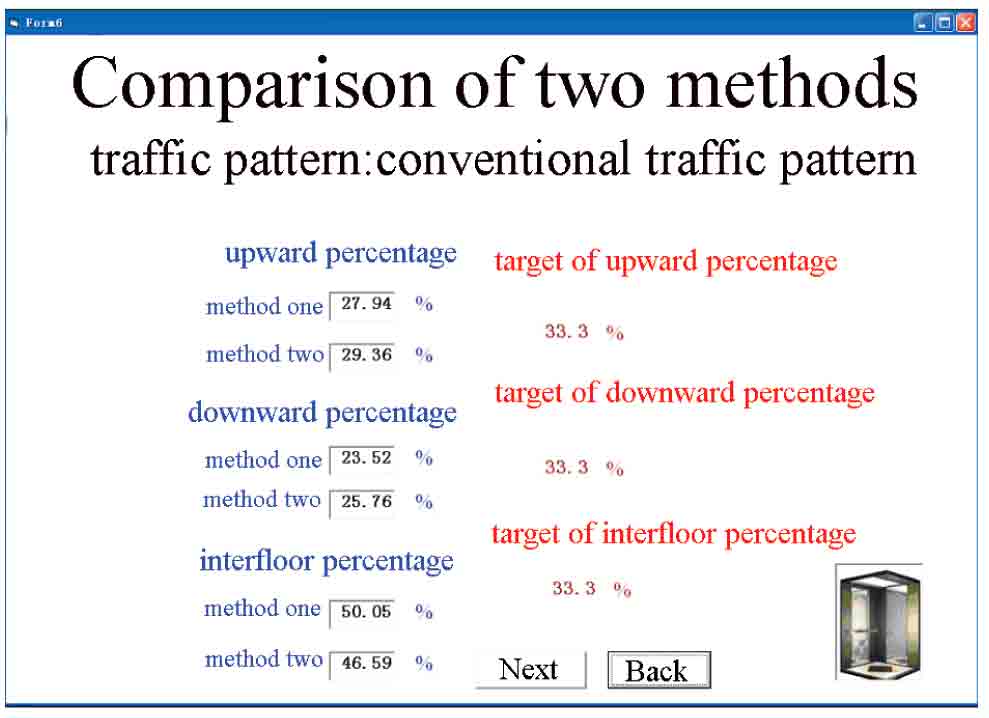
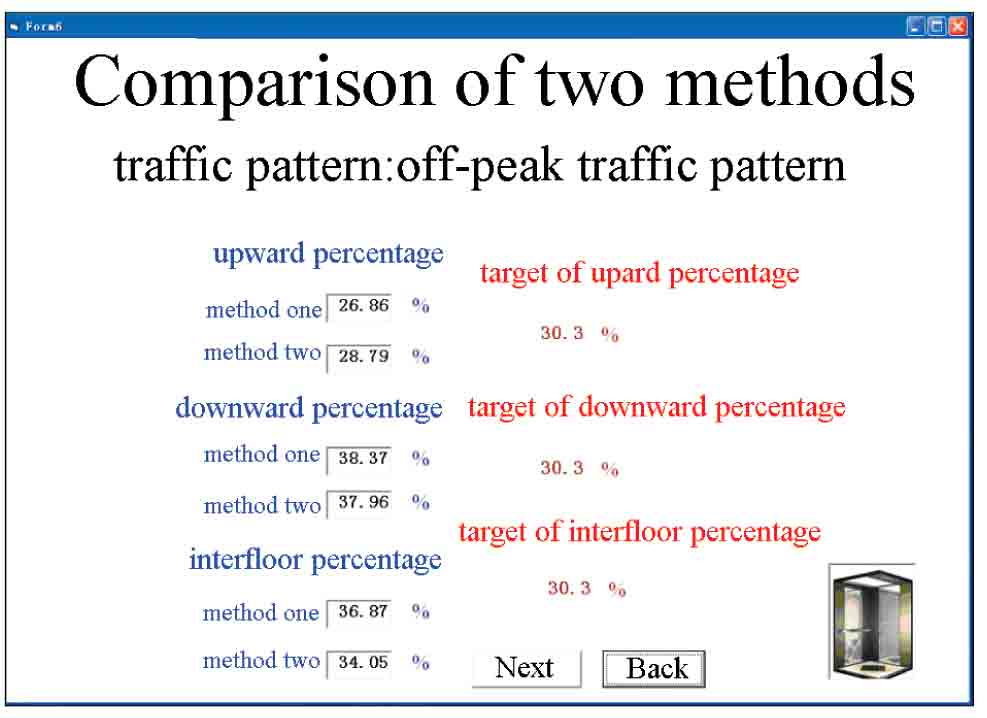
Figure 4: Comparison of two methods in different traffic patterns
Conclusion
Establishing a probability model is the key issue for using the Monte Carlo method. An unanswered question is related to this probability model. The roulette model is fit for describing the behavior of passengers. Calculating the cumulative probability value decreases the error value. The elevator traffic-flow prediction based on Monte Carlo is of considerable practical value.
Acknowledgements
This project was supported by the National Natural Science Foundation of China (60874077) and Administration of Quality Supervision, Inspection and Quarantine of China Nonprofit Industry Specialized Research Funding Projects (200910097 and 201010057).
References
[1] Zhifeng Pan, Fei Luo, Yuge Xu. “Elevator Traffic Flow Model Based on Dynamic Passenger Distribution [A].” Proceeding of the 2007 IEEE International Conference on Control and Automation: 2386-2390.
[2] Jianru Wan, Zhichao Zhang, Yingpei Liu. “A New Elevator-Group Control Method Based on the Blending of Genetic Algorithm and Neural Network [J].” ELEVATOR WORLD, September 2007.
[3] Qun Zong, Youjun Yue. “A Traffic Flow Forecasting Method of Elevator Group Control System [J].” Systems Engineering and Electronics. 2001,23(7): 102-104.
Get more of Elevator World. Sign up for our free e-newsletter.


