
Elevator energy efficiency optimization according to ISO 25745
by Eng. Mantovani
Elevator energy efficiency represents an increasingly decisive parameter in tender specifications where energy class features as contractual constraint. This article explains how counterweight balancing optimization enables improvement of the system’s energy classification by analyzing the transition from traditional 50% balancing to alternative configurations and specifically with 30% balancing.
Introduction and Analysis of Elevator Usage Behavior
The Traditional Balancing Paradox
Elevator systems are conventionally balanced at 50%, meaning the counterweight equals the car weight plus 50% of the rated load. In this configuration, when the car carries half of the maximum load, the system is perfectly balanced and elevator movement requires no power (neglecting friction). However, when the car is empty or fully loaded, energy demand during transportation reaches maximum values.
This balancing approach minimizes traction machine dimensions at full load, but does not necessarily represent the most energy-efficient choice.
Behavioral Analysis of Daily Usage
A simple analysis of daily behavior reveals some significant aspects:
- Empty car predominance: In most cases, the elevator runs empty.
- Overcrowding avoidance: When the car appears excessively crowded, users tend to wait for the next trip.
- Undersized utilization: Even in “crowded-perceived” conditions, actual load remains significantly lower than maximum permitted capacity.
These raw statistics clearly indicate that elevators operate predominantly with empty cars and very rarely at maximum load. Consequently, if the system consumes maximum energy precisely in the most frequent operating condition (empty car), overall energy efficiency is not optimal.
Regulatory Foundations
ISO 25745 Standard Principles
The ISO 25745 standard defines elevator energy classification through real energy measurements during running and standby phases, subsequently weighted using statistical coefficients to estimate daily and annual energy consumption.
In this article, we will focus on the running energy aspect where the standard requires energy measurement at the control panel input terminals during round trips with an empty car.
Calculation Methodology
From empty car measurements, corrective coefficients are subsequently applied for estimating average daily consumption, based on:
- System traffic profile
- Number of floors served
- Rated load
- Balancing percentage
- Daily energy consumption estimation
- Specific energy per meter of travel and kilogram of load
Energy implication: Since the reference measurement is performed with an empty car, a reduction in consumption under this condition directly translates to an improvement in final energy classification.
To better understand the impact of balancing, let’s perform a theoretical analysis of the energy required in a complete trip, neglecting friction and traction machine losses in a typical elevator.
Theoretical Balancing Analysis:
Case 1
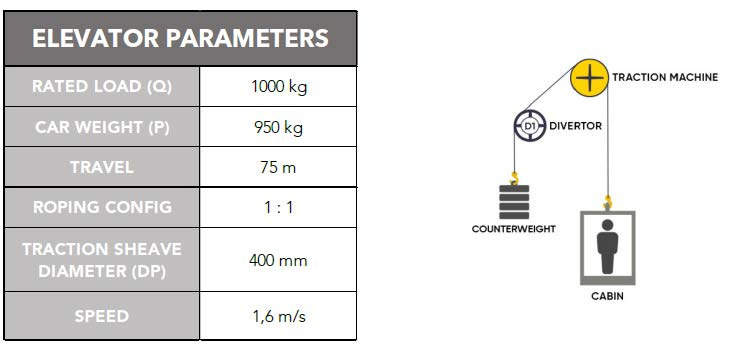
50% Balancing → Counterweight (CWT) = 1450 kg
Energy Consumption Down Empty = (CWT – P) × g × Travel = (1450-950) × 9.81 × 75 = 368 kJ = 102 Wh
Energy Consumption Up Empty = 0 Wh (traditional system with energy dissipation on brake resistor)
Case 2
30% Balancing → CWT = 1250 kg
Energy Consumption Down Empty = (CWT – P) × g × Travel = (1250-950) × 9.81 × 75 = 221 kJ = 61 Wh
Energy Consumption Up Empty = 0 Wh (traditional system with energy dissipation on brake resistor)
Case 3
0% Balancing → CWT = 950 kg
Energy Consumption Down Empty = (CWT – P) × g × Travel = (950-950) × 9.81 × 75 = 0 Wh
Energy Consumption Up Empty = 0 Wh (traditional system with energy dissipation on brake resistor)
Result: The energy advantage of reducing balancing is immediately evident even from this simplified theoretical analysis.
Traction Machine Implications
Required Torque Calculation
However, balancing reduction inevitably results in an increase in torque that the traction machine must provide:
Case 1
50% Balancing
Machine Torque = (Q + P – CWT) × g × DP/2000 = (1000+950- 1450) × 9.81 × 400/2000 = 981 Nm
Case 2
30% Balancing
Machine Torque = (1000+950-1250) × 9.81 × 400/2000 = 1373 Nm Case 3
0% Balancing
Machine Torque = (1000+950-950) × 9.81 × 400/2000 = 1962 Nm
Economic and Dimensional Impact
Since traction machine and brake system dimension and cost are closely correlated to required torque, this parameter assumes significant economic relevance in system design.
Regulatory Constraints: Suspension Media Traction
Traction Criticality
Balancing reduction significantly impacts suspension mean traction verification conditions according to EN 81-20, particularly when the following conditions become more critical:
- Traction test at 125% of rated load
- Emergency stop during down travel at full load
These verifications become progressively more difficult to satisfy as balancing percentage decreases. It is therefore necessary to identify the optimal compromise between maximum energy efficiency, machine cost/size optimization and compliance with suspension mean traction requirements.
Experimental Analysis: Real Calculations With All Parameters
Here is a complete calculation according to ISO 25745, considering friction, losses, auxiliary consumption (doors, control panel).
50% Balancing Configuration

Energy results:
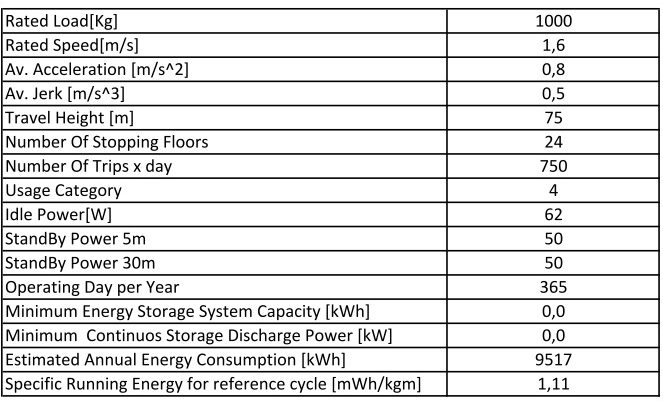
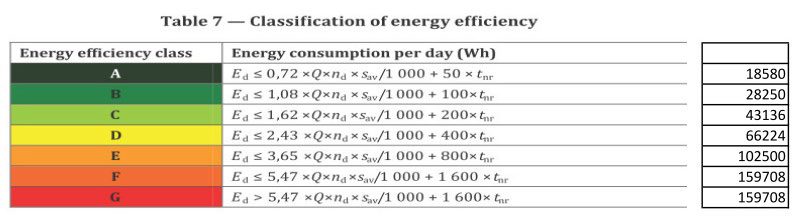
- Estimated Daily Energy Consumption Ed [Wh]: 26.074 Wh → Energy Class B
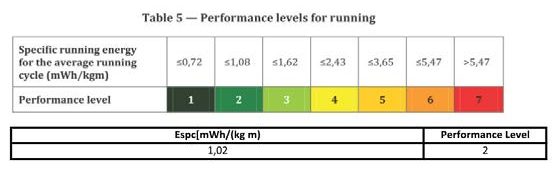
- Specific Running Energy ESPC [MW/(KG·M)]: 1.02 mWh/(Kgm) -> Level 2
- Estimated Annual Energy Consumption: 9.517 kWh
The gearless machine selected for this configuration has a 78% efficiency, but even with ideal machine (100% efficiency — not really achievable) Ed, it would have been 21.614 Wh not enough to reach A class (<18.580Wh).
30% Balancing Configuration
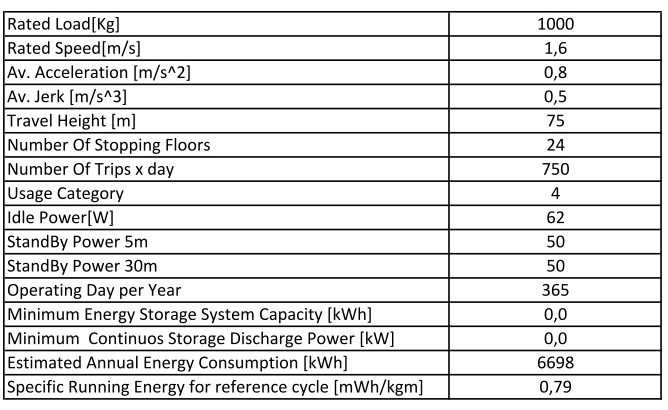

Energy Results:
- Estimated daily energy consumption Ed [Wh]: 18.352 Wh → Energy Class A
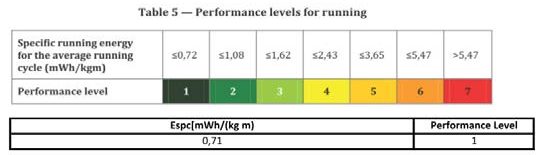
- Specific running energy ESPC [MW/(KG·M)]: 0,71 mWh/(Kgm) -> Level 1
- Estimated annual energy consumption: 6.698 kWh
Final Economic and Technical Analysis
- Annual energy savings: 9.517 – 6.698 = 2.819 kWh
- Annual economic savings: 2.819 kWh × €0.287/kWh = €810 (based on European average electricity cost)
- Traction machines’ selection: The recommended alternative configurations require bigger gearless machines to be installed, yet the significant energy savings enable and completely amortize the higher machine cost already in the first year of operation. The economic and environmental sustainability of the balancing revision is clearly demonstrated.
- Code compliance: EN 81-20 Traction Regulation is completely met, even with 30% balancing.
Technical Conclusions and Recommendations
From an energy perspective, adopting balancing below traditional 50% represents a simple yet effective solution for improving energy classification and reducing operating costs. This technically validated approach is becoming a preferred strategy for elevator industry designers and installers to scale system energy classification and gain competitiveness in tenders with energy constraints while obtaining significant energy savings and minimizing the environmental impact of the elevator industry.
Get more of Elevator World. Sign up for our free e-newsletter.
![]()


![]()