Daily Traffic Profiles
Jan 1, 2014
The traffic patterns of hotels and residential buildings is examined in this revisiting of Strakosch’s analysis.
by Dr. Marja-Liisa Siikonen, Janne Sorsa, Juha-Matti Kuusinen and Henri Hakonen
Traffic patterns for morning up-peak, lunch hour and daily traffic are simulated to determine passenger-service levels during traffic peaks and throughout the day. In the latest publications on traffic simulation, attention is mostly paid to elevator traffic performance in office buildings. In 1976, George Strakosch[1] published profiles for 10- to 12-hr. daily traffic in offices, parking structures and garages, shopping centers, hospitals, schools, hotels/motels, apartment buildings and dormitories. His method was to count people entering and exiting elevators in main lobbies. Since then, no new traffic profiles have been published, except for office buildings. This article studies whether the Strakosch profiles are still valid today by comparing them to recent traffic measurements in buildings in Europe, North Africa and the Far East. It also reviews current planning practices of hotel and residential-building elevators against the measured data.
Traffic Measurements
The recent traffic measurement used three methods.[5] First, an external device counted the people from photocell cuts on every floor.[2] Each passenger was assumed to produce two photocell cuts, one each when entering and exiting the car. The second method was based on a control system, which counted the number of passengers entering and exiting per floor and direction at every floor throughout the day.[3] It used a car-load weighing device and photocell signals to count the passengers. The first two methods are capable of detecting interfloor traffic. The third method was manual counting of people in and out the elevators at the main lobby.
Measurements were conducted in hotels in Finland using method 1, Egypt and the U.A.E. using method 2 and Singapore using method 3. The measured hotels had four- to five-star ratings. The estimated number of hotel guests was 170 in Finland, 490 in Dubai, 700 in Singapore and 1,240 in Egypt. In the population estimation, occupancy per room was assumed to be 1.7 persons.
Traffic in residential buildings was measured in Finland and Singapore using method 3, France using method 1 and Hong Kong using method 2. The population was estimated from the rooms by assuming two persons in the first bedroom and one person in each additional bedroom. The estimated number of occupants in Finland was 100, in Singapore 400, in France 500 and in Hong Kong 760.
Individual measurements were combined into a worst-case profile. In the profile, the maximum arrival rate of the four measurements and the average of the traffic components were calculated for each 15-minute interval of the day.
Hotel Traffic Profiles
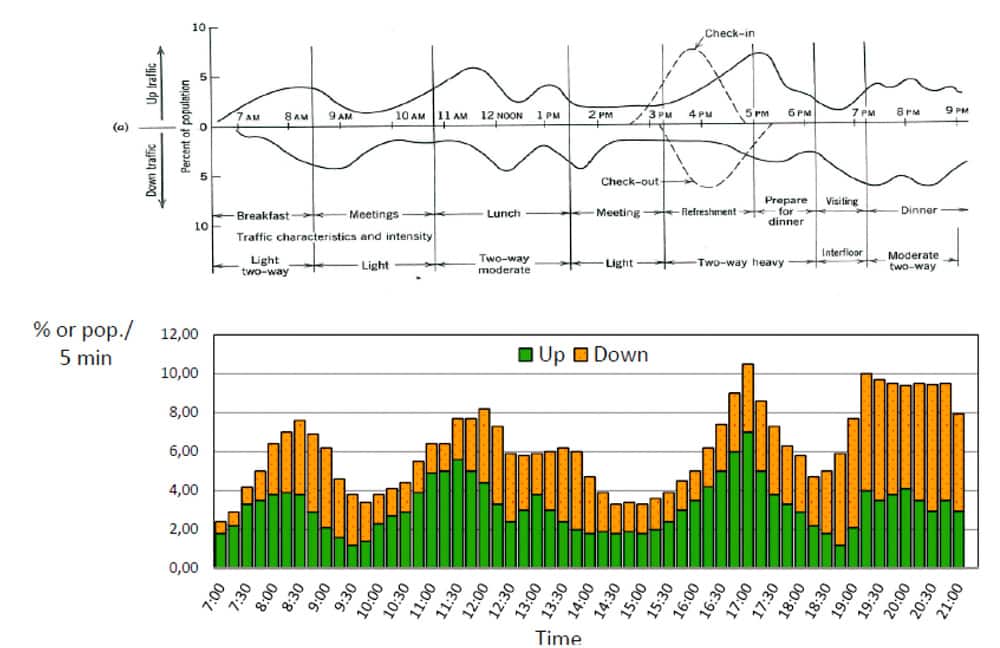
The Strakosch hotel/motel profile in Figure 1 shows a traffic peak from 8-9 a.m., when people go to breakfast and return to their rooms. Other peaks occur during the noon lunch hour, when people check in and out in the late afternoon, and in the evening at dinnertime. An accumulated hotel profile based on the original two-way profile is also shown in the figure. According to this profile, the highest traffic peak of 10-11% of the number of hotel guests in 5 min. occurs at 5 p.m., when people check in and out and prepare for dinner.
The measurement results and the Strakosch profile are depicted in Figure 2. In the profile estimated from the measurements, there are two traffic peaks: one in the morning and the other at about 5 p.m. The inter-floor traffic is caused by the common floors, including gyms, restaurants, meeting rooms and business-center floors. The maximum arrival rate was 9.5% of the population in 5 min., which is a bit lower than the highest peak in the Strakosch profile. The measured morning peak, however, is a bit higher, since nowadays, people check out mostly in the morning. Otherwise, the two profiles are in line with each other.
Traffic Profiles of Residential Buildings
The Strakosch apartment-building traffic profile is presented in Figure 3. It has three peaks: one at noon during lunch hour, another at 3 p.m. when children return from school and a third at 6 p.m. when people return from work. The peak heights are a bit more than 7% of the population in 5 min. In the morning, there is mainly outgoing traffic: otherwise, the traffic is more or less two way throughout the day.
Figure 4 shows the worst-case profile of the measured buildings and Strakosch profile. The measured traffic was two way throughout the day. There is a down peak in the morning and somewhat more incoming traffic in the evening. The portion of inter-floor traffic is almost negligible. The traffic intensity is lower than measured by Strakosch, the maximum being 5.7% in 5 min. The 15 intervals in the measured profile somewhat flatten the peaks compared to the 5 min. interval. The measured profile does not show the lunch and “children home” peaks. “Work over” and “children back from school and hobbies” occur from 4-6 p.m. These timings likely depend on the culture.
Current Planning Practices for Hotels and Residential Buildings
Most hotel chains, such as Accor, Hilton, Hyatt, Marriott, Four Seasons, Starwood, Ritz-Carlton and Radisson, have their own vertical-transportation standards. For luxury or high-rise hotels, the selection of guest lifts is based on two-way traffic analysis. In the planning, 40-55% of the car-load factor should be used instead of 80%, since guest luggage reduces available space. Handling-capacity criteria is in the range of 12-16% in 5 min. In resort hotels and motels, handling capacity of 10% in 5 min. is acceptable.
Hotel population is usually estimated at a density of 1.5–1.9 guests per room.[4] In Figures 2 and 4, the population defined at the planning stage was used to scale the measurement results, since the real population at that time is unknown. The population estimation affects the scaling of the traffic peaks from the absolute number of persons to the percentage of population. The measured traffic peaks were about 9-10% in 5 min. During the measurements, however, the hotels were not fully booked. With maximum occupancy, peak arrival rates can reach well over 10% of the population in 5 min. According to the measurements, there is about 40% incoming and outgoing traffic and about 20% inter-floor traffic. The amount of inter-floor traffic depends very much on the floor arrangement and the culture. The current hotel criteria do not take into account the interfloor traffic but could be considered in the future.
In selecting the elevator arrangement for low-rise apartment buildings, the best practice is to follow local standards. The population can be estimated from the number of bedrooms, usually assuming 1.5–2 persons in the first bedroom and 1-1.4 persons in additional bedrooms. Strakosch[1] suggests 20 m2 of net area per person when the residential floor layout and utilization is unknown, or 1.5-2 persons per bedroom.
Normally, two-way traffic in apartment buildings is assumed in elevator planning, and handling capacity requirements vary 5–9% in 5 min. These requirements match the measured daily traffic profiles. At the planning stage, the same 40-50% car-load factor could be used (instead of 80%). The extra space is needed for baggage, baby carriages and other objects transported in residential-building elevators. At the moment, there are no specific criteria for the car-load factor in residential buildings.
Conclusion
The suggested traffic profiles do not include any measurements from the U.S. The Strakosch hotel/motel profile, however, highly resembles the measured hotel profiles. In the residential traffic profiles, there are differences in the midday traffic, which can be explained by changes in people’s living habits over the last 40-50 years. The measured profiles more represent today’s traffic, and these can be used as templates for hotels and residential buildings if accurate traffic is unknown. Exact figures for the given profiles can be found in “Traffic Patterns in Hotels and Residential Buildings.”[5]
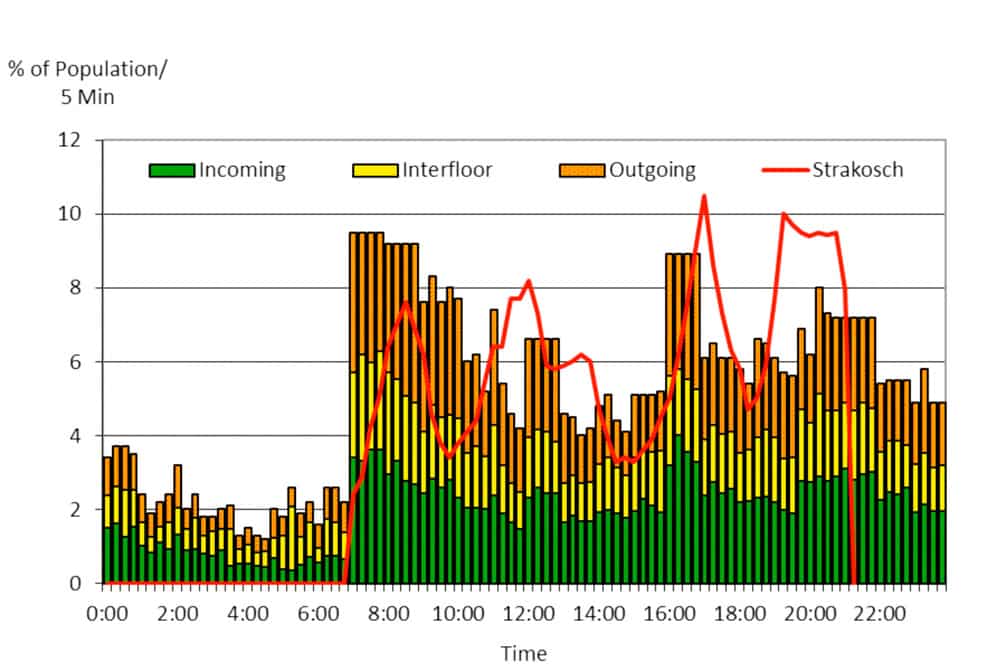
Figure 2: Measured daily traffic profile and total arrival rate of Strakosch profile of hotels; traffic stacked in 15-min. intervals 
Figure 3: (Top to bottom) Strakosch traffic profile for an apartment building and an accumulated profile 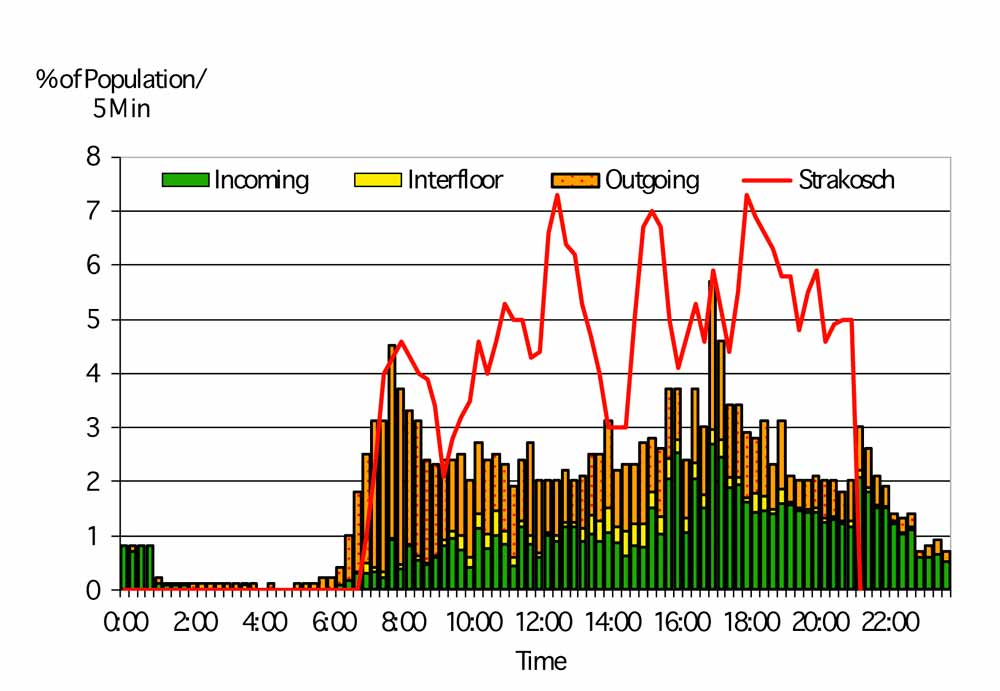
Figure 4: Measured daily traffic profile and total arrival rate of Strakosch profile of residential buildings; traffic components stacked in 15-min. intervals.
References
[1] George R. Strakosch, Vertical Transportation Elevators and Escalators, John Wiley & Sons, New York, 1982.
[2] M. Kaakinen and N.R. Roschier, “Integrated Elevator Planning System,” ELEVATOR WORLD, No. 3, 73-76, 1991.
[3] M-L. Siikonen, and M. Kaakinen, “TMS9000 Group Control – Using Artificial Intelligence to Improve Passenger Service Quality,” Lift Technology 5, Stockport, England: IAEE Publications, 238-246 1993.
[4] The Chartered Institution of Building Services Engineers, CIBSE Guide D: 2010, Transportation Systems in Buildings. Page Bros. (Norwich) Ltd., Norwich (2010).
[5] M-L. Siikonen, “Traffic Patterns in Hotels and Residential Buildings,” 3rd Symposium on Lift and Escalator Technologies, Northampton, 2013.
Get more of Elevator World. Sign up for our free e-newsletter.


