Elevator Traffic Analysis: Analytical Versus Simulated
Jan 1, 2015
The two main classifications of traffic analysis are compared and contrasted, with the work of many experts in the field cited.
by Dr. Albert So and Dr. Lutfi Al-Sharif
Traffic analysis is one of the three key areas associated with the study of elevator systems, along with drives and safety components. Elevator traffic analysis is fundamental to the planning and design of elevator systems. Over the years, different approaches have emerged, and they can be broadly classified into “analytical” and “simulated” categories. This article explores how these two approaches supplement each other, as well as a third approach, based on numerical methods (in effect, hybrids of the other two).
CIBSE Guide D: Transportation Systems in Buildings (with the 2010 edition being the latest) has been widely used around the world (in particular, Europe and Asia) as a useful reference by elevator engineers, planners, architects, consultants and code makers. These two approaches are mentioned as two models in Chapter 3 of the Guide. The first model uses a calculation method based on mathematical formulae, usually applicable to up-peak situations. Such a classical model has been used for nearly 80 years and results in a satisfactory solution for 90-95% of designs. This model is referred to the “analytical one” in this article; in it, a designer can perform the design by hand based on the equations available. The second model, which has been in use for more than 45 years, is based on a discrete digital simulation of the movement of elevators in a building and passenger dynamics. When the Guide was prepared, simulations were considered relatively slow, but as computer technology advanced, there has been a quantum leap in the performance of simulations due to higher processing power that has led to shorter simulation times.
The entire process of simulation is presented in Chapter 4 of the Guide. It starts with passengers arriving at the landings, followed by registering their landing calls, boarding the elevators when they arrive and registering their car calls. It ends with passengers alighting at their destination floors. It is accepted that simulation is, by itself, a very powerful tool. However, the Guide suggests that the good practice is to start all design exercises with a traditional round-trip time (RTT) calculation for the following reasons:
- The traditional analytical methods are well proven and have stood the test of time. Any differences found between results from the two approaches could alert designers to errors in the simulation.
- Simulation is rather complicated, and it is easy for less-experienced designers to make mistakes or unknowingly miss something.
- RTT calculations are easier and faster. So, the analytical methods could help guide designers adopt solutions that are worth testing by simulation.
Having said that, the Guide appreciates that simulations can model the elevator movements on a trip-by-trip basis, while the analytical method works on an “average” round trip. Moreover, simulations can evaluate passenger waiting time, transit times, dwell times, lobby times, etc., while the analytical method gives only an average interval. Simulations are much closer to “real life” and, therefore, more intuitive; they can model the supervisory control performance and, finally, can display a wide range of tables and graphs for designers’ reference.
Janne Sorsa and Dr. Marja-Liisa Siikonen are of the opinion that elevator planning for multistory buildings has been based on up-peak RTT calculation, while other traffic conditions are analyzed with elevator traffic simulation.[16] Traffic simulation is also absolutely essential when planning advanced elevator systems for which standard up-peak equations do not apply. Such an opinion is in line with the Guide.
Analytical Calculations
There are two approaches here: namely, derivations from first principle or from empirical formulae. As discussed earlier in this article, the underpinning consideration of the analytical approach is the RTT evaluation during an up-peak condition. The most widely used equation for such condition (noted in the Guide and works by Dr. Gina Barney[5 & 7]) is:

Here, tv = df/v, where df is the interfloor distance, v is the rated speed of the car, P is the number of passengers in the car, and ts (called “stopping time”) is tf(1) + to + tc – tv. (tf(1) is the single-floor flight time representing the time of acceleration and deceleration, to is the door-opening time, and tc is the door-closing time.) H is the highest reversal floor of the typical round trip; S is the expected number of stops of the trip. H (first derived by J. Schroeder[13]) and S (first derived by Basset Jones[9]) are given below.
For non-uniform population distribution around the building with N number of floors (excluding the ground floor), Ui is the possible number of occupants at the ith floor, with i running from 1 to N.
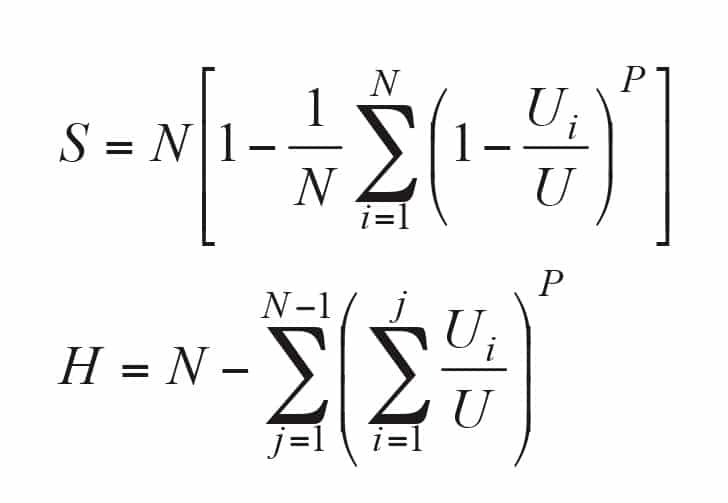
If U1 = U2 = ….. = UN = U/N (i.e., uniform population distribution around the building with a total population, U), the two equations are simplified to:

The average time, during up-peak, taken by a passenger to travel from the ground floor or the main terminal to the destination floor is called “up-peak average travel time” (UPATT), given by:

which can be simplified to:

when S >> 1.[14 & 15]
The average up-peak journey time spent by a passenger from the moment he or she arrives at the lobby of the main terminal until exiting the elevator at his or her destination floor (UPAJT), is equal to the sum of UPATT and the up-peak average waiting time, UPAWT. Equations above have been derived from first principle without any data from onsite traffic surveys. The equation above assumes a plentiful supply of passengers in the lobby and that there are always passengers (P) available to board the elevator when an elevator arrives at the main lobby to pick up passengers. The equation must be modified to account for a Poisson passenger arrival process.
Poisson distribution is a discrete probability distribution that gives the probability of a given number of events occurring in a fixed interval of time and/or space, provided that events occur with a known average rate and are time independent. A discrete random variable (X), usually an integer indicating the number of particular events, said to be Poisson distributed with a positive real parameter (λ) can be given by the following equation, with k = 0, 1, 2, . . .:

λ is the arrival rate, in events per second or passengers per second. Hence, the shape of the distribution curve is dependent on the value of the parameter λ. It is interesting to know that both the mean and variance of the Poisson distribution are equal to λ.
A second type of analytical calculation belongs to the class of empirical formulae based on curve fitting from a pool of data collected during onsite traffic surveys or simulations (i.e., statistics based). For example, the UPAWT formulae suggested by Barney represent this type:[6]

Here, UPINT stands for up-peak interval; CC stands for contract capacity of the car, and P is as previously defined.
Simulations
In addition to its use for system planning and design, simulation is also widely used for assessing group control algorithms.[2, 8 & 12] Simulation is either implemented as time-sliced simulation[11] or discrete event simulation.[1] There are different simulators available on the market. One popular software tool to use as an example for a more detailed discussion is Elevate.[10] During the simulation, all events are advanced by fixed size time slices (say, 0.1 s.), and, as time advances, events change, traced by the computer program. Events include patterns of passenger arrival at different landings: passenger demand, traffic patterns, registration of landing calls, car movement, boarding and leaving the car, registration of car calls, etc. Different simulation results are obtained when the passenger demand changes from low to high, but the initial conditions should remain unchanged. And, a simulation should last long enough to make the results stable enough and usable by the designers. Useful results may include RTT, handling capacity, passenger waiting time (minimum, average or peak), passenger travel time (minimum, average or peak), average number of stops, average highest reversal floor, passenger transfer time, etc.
The art of object-oriented programming (OOP) has been adopted. In an object, both the variables and functions are grouped together, the behavior of which is defined by the class to which it belongs. Each object is, thus, an “instance” of a class. In Elevate, there are different classes, such as “building class,” which comprises the number of floors, array of floor heights, etc.; “motion class” is comprised of the rated speed, rated acceleration, motor start-up delay, etc.; “elevator class” is comprised of the contract capacity, door opening/closing time, etc.; “dispatcher class” is comprised of the dispatcher algorithm, up landing calls, down landing calls, etc.; and “person class” is comprised of the arrival floor, destination floor, passenger weight, etc. Furthermore, users are allowed to build their own dispatching algorithms into the simulation for comparison of performances. It is expected that this simulation tool could be used in the future to run in parallel with a real elevator system for benchmarking all traffic parameters and assessing satisfactory performance.
Numerical Methods
Any tool used to assess the efficacy of an elevator group control algorithm must meet the following four requirements:[3]
- Repeatable: the original designer must be able to get the same result over a number of runs of the same system with the same parameters.
- Reproducible: other designers/users must be able to get the same results as the originator of the group control algorithm.
- Transparent: the user should be able to easily understand how the group control algorithm works, how it has been implemented and which parameters have been assumed, as well as the values used for each parameter.
- Objective: the tool must be an objective one that will allow comparisons between different group control algorithms under similar conditions.
While it is accepted that simulation is a powerful tool for assessing the effectiveness of elevator group control algorithms and can deal with the most complicated conditions and scenarios, it sometimes cannot meet all these requirements. Furthermore, suppose there are L elevators in the group, and each can carry P number of passengers. Every passenger has a destination floor. It can be shown that the number of unique possible solutions could
be up to ![]() , which is an astronomical figure.[4] For example, a building 10 stories high with five elevators each carrying 12 passengers could have up to 3.3 X 1098 solutions, which could not be handled by any supercomputer in the world.
, which is an astronomical figure.[4] For example, a building 10 stories high with five elevators each carrying 12 passengers could have up to 3.3 X 1098 solutions, which could not be handled by any supercomputer in the world.
By numerical methods,[3] a sample of possible scenarios is taken and handled by Monte Carlo simulation, and the final judgment is based on heuristics, or rules of thumb. The following steps outline how numerical methods are carried out:
- A new scenario is generated using a random scenario generator so that each passenger is randomly assigned to a floor with the probabilities linked to the floor populations.
- For each possible scenario generated in step 1, the most suitable solution is found by heuristic methods or by using random search techniques.
- Steps 1 and 2 are repeated until a large number of scenarios have been considered (say, 10,000 or even 100,000), still compatible with the capacity of a good personal computer.
- Once done, the average value of the best solution for all the scenarios is calculated and used as a representative assessment of the group control algorithm.
Conclusion
The three approaches of elevator traffic analysis (analytical, simulated and numerical) have been discussed. The numerical method could be thought of as a merger between a limited number of simulation scenarios and analytical equations. The analytical method has been used for decades and is well proven, having gained the trust of building owners, users, designers and architects. Simulation is more realistic and better reflects what actually happens with an elevator system serving a real building.
Currently, an International Organization for Standardization (ISO) Technical Committee (TC), ISO/TC 178/SC/WG6, chaired by Siikonen, is working on the draft ISO 4190-6, which is about the planning and selection of passenger elevators for use in office buildings, hotels and residential buildings. It is apparent the TC honors both calculation methods based on up-peak RTT equations and guided simulations.
A validation on the up-peak RTT equations by both simulated up-peak traffic and measured data of real up-peak traffic was conducted in 2014.[16] It was shown that both the simulation and real situation fulfilled the assumptions of the analytical up-peak theory. The results reveal the theoretical up-peak calculation accurately represents real traffic only if the equations are based on passenger batches, instead of individual passengers. In the conclusion, the article states that calculation has to be conducted with realistic elevator parameters and passenger transfer times.
As a final remark, your authors are of the opinion that both calculations and simulations are essential in elevator system traffic design and analysis. As computer technology advances, simulation time, whether time sliced, event based or numerical, is getting shorter and shorter, while results from simulations can give us real and trustworthy information to allow the design of elevator systems to handle different kinds of traffic conditions. On the other hand, a quick calculation must be performed well before a simulation is conducted. We would like to quote Barney’s speech as recorded in the May 2007 “CIBSE Traffic Analysis & Simulation Open Forum Report” to end this article:
“Barney was also worried about the overreliance on simulation vis-à-vis traffic calculations. She considered that designers should understand their art properly. This understanding is best approached by carrying out a few simple calculations. She did agree, however, that the final results should always be confirmed by simulation, as calculations are precisely mathematically derived and often bear no resemblance to a simulation.”
References
[1] Al-Adem, Mohamed D. Discrete Event Simulation of Multi-Car Elevator Systems, final year graduation project, University of Jordan, 2012.
[2] Al-Sharif, Lutfi and Al-Adhem, Mohamed D. “The current practice of lift traffic design using calculation and simulation”, Building Services Engineering Research and Technology, Vol. 35, No. 4, 2013.
[3] Al-Sharif, Lutfi; Hussein, M.; Malak, M.; and Tuffaha, D. “The use of numerical methods to evaluate the performance of up-peak group control algorithms”, Elevator Technology 20: Proceedings of Elevcon 2014, International Association of Elevator Engineers (IAEE), 2014.
[4] Al-Sharif, L.; Hamdan, J.; Hussen, M.; Jaber, Z.; Malak, M.; Riyal, A.; AlShawabkeh, M.; and Tuffaha, D. “Establishing the upper performance limit of destination elevator group control using idealised optimal benchmarks (IOB),” submitted for review in Building Services Engineering Research & Technology, March 2014.
[5] Barney, G.C. and dos Santos, S.M. Elevator Traffic Analysis, Design and Control, 2nd Edition, IEE, Peter Peregrinus Ltd., London, 1985.
[6] Barney G.C. “Uppeak revisited”, Elevator Technology 4: Proceedings of Elevcon 1992, IAEE, 1992.
[7] Barney, G.C. Elevator Traffic Handbook: Theory and Practice, Spon Press, Taylor & Francis, London, 2003.
[8] Hakonen, H. and Siikonen, M. “Elevator traffic simulation procedure”, Elevator Technology 17: Proceedings of Elevcon 2008, IAEE, 2008.
[9] Jones, Basset. “The probable number of stops made by an elevator,” GE Review, Vol. 26, 1923.
[10] Peters, Richard. “Current technology and future developments in elevator simulation,” International Journal of Elevator Engineers, Vol. 4, No. 2, 2002.
[11] Peters Research, Elevate: Elevator Traffic Analysis & Simulation Software. “Getting Started,” Version 8, 2010.
[12] Peters, Richard. “The application of simulation to traffic design and dispatcher testing,” Proceedings of the Third Symposium on Lift and Escalator Technologies, University of Northampton, 2013.
[13] Schroeder J. “Personenaufzuege,” Foerden und Heben, Vol. 1, 1955.
[14] So, Albert T.P. and Suen, Wilson S.M. “New formula for estimating average travel time,” Elevatori, Vol. 31, No. 4, 2002.
[15] So, A.T.P. and Suen, W.S.M. “Assessment of real-time lift traffic performance,” Building Services Engineering, Research & Technology, Vol. 23, No. 3, 2002.
[16] Sorsa, Janne and Siikonen, Marja-Liisa, “Up-peak roundtrip time in theoretical calculation, traffic simulation and reality,” Elevator Technology 20: Proceedings of Elevcon 2014, IAEE, 2014.
Get more of Elevator World. Sign up for our free e-newsletter.


