Energy Models for Lifts
Apr 1, 2013
by Ana M. Lorente-Lafuente, Dr. José Luis Núñez-Bruis and Dr. Gina Barney
Lifts are essential for the operation of a building and contribute to its energy burden. They use energy in one of three main modes: standby (when the lift is dormant), running (when the lift is moving) and idle (when the lift is between standby and running modes). The proportion of time taken in each mode, and hence the energy consumed, depends on many factors, including type of building, traffic patterns and technology used. This article gives data for these time proportions for a specific installation by means of simulation tools, based on a set of buildings. In addition, other important parameters are presented to enable accurate estimations of energy usage to be determined.
Introduction
The demand for energy-efficient lifts has increased in recent years, fostered, for example, by the European Directive on the Energy Performance of Buildings. There are also several international initiatives for buildings classification, such as the Building Research Establishment Environmental Assessment Method, Leadership in Energy and Environmental Design, the Comprehensive Assessment System for Built Environment Efficiency, etc., as well as an international standard ISO 25745-1:2012[1] and some national guidelines, such as VDI 4707.[2]
Any method of assessment/classification requires reliable methods for calculating the total energy consumption of a lift during a given period, according to which the overall energy efficiency can be assessed. Some of these methods incorporate formulas for estimation, whereas others leave the choice to the manufacturer. Different methods have been proposed, and most calculate the energy consumption of the lift in two main operating conditions: running (when the lift is moving) and standing (when the lift is stationary). The second mode can be further split into standby mode (when the lift is dormant) and idle mode (when the lift is between standby and running modes). The energy efficiency of a lift is intimately associated with the building in which it is installed and how the building population uses it. This usage can be used to develop classification labels for lift installations.
While the energy consumed in each operating condition can be easily measured, for example, using the methodology described in ISO 25745-1:2012, or estimated from the mechanical and electrical components of the lift, there are no clear rules on how to estimate the other relevant parameters. This paper shows how to obtain the parameters by means of simulation tools and provides data for general usage.
Definition of the Objectives
The ISO/TC 178/WG 10 Committee was tasked to provide a means to classify the energy efficiency of lifts in use. To achieve this, it is necessary to carry out an accurate calculation of the estimated energy usage. The research described here supported the work of Working Group (WG) 10.
For a certain installation, where the characteristics of the building (number of floors, total height of the building, inter-floor height, population and level of demand, etc.) and the lift(s) installed in it are known, the daily operation of the lift(s) can be emulated using simulation software. One of the results that can be obtained from a simulation is the spatial plots of each car’s movement. Using this spatial plot, it is possible to calculate the occurrences in each possible trip, characterized by distance traveled, direction of movement and load carried in a specified period. Then, knowing the number of trips, it is possible to easily estimate the energy consumption. To assist WG 10, it was necessary to obtain values for the following parameters:
- Average distance traveled
- Average load carried
- Average time spent in running and standing conditions (idle and standby)
These parameters ideally should be obtained for many building types (residential, office, hotel, hospital, airport, transport stations, schools, universities, etc.) and for different intensities of use (low, medium, high, etc.) represented by the number of starts per day. The objectives of this work are, therefore, to analyze the factors that influence the usage of a building and to issue application tables that can allow the estimation of the energy consumption of lifts. A set of standard benchmark buildings has been selected and the main parameters (type of building, level of demand, traffic patterns, lifts mechanical parameters, etc.) have been defined.
A publicly available traffic-simulation software, ELEVATE™, has been used (with some customization for this research) to simulate different scenarios, considering the population movement from floor to floor. The results, obtained in the form of spatial plots or list of trips, have been processed, and the values of average distance traveled, average load carried, proportion of time spent in each energy mode (running and standing [standby, idle]) have been calculated. This information allows the calculation of the total energy consumed in a period, depending on different building or lift configurations.
Simulation Protocol Design
Analysis Type
ELEVATE performs simulations using statistical procedures to digitally model specified lift installations. A large quantity of data is collected and presented in different ways (peters-research.com/index.php?option=com_content&view=article&id=96&itemid=91).
Traffic-Control Algorithm
The traffic-control system (dispatcher algorithm) determines how the lifts will serve the calls placed on the system by the passengers. The ISO 25745 series of standards does not consider the effects of the traffic-control system and only considers a single lift. To obtain plausible results, the research reported here considers two-car (duplex) installations operating under two simple traffic-control algorithms: the basic group collective (COL) and the estimated time of arrival (ETA) control algorithms only. The modern hall-call allocation (destination control – see CIBSE Guide D: 2010, Chapter 9[3]) is not considered.
Building Data
Initially, it was decided to consider office buildings with five, 10 and 16 floors (the latter considered the maximum practical number of floors in a building zone) above the main terminal. Later, some simulations were carried out with two, three and four floors above the main terminal to accommodate residential buildings at the request of WG 10. Buildings with express zones or parking zones were not considered, as they are not part of the ISO 25745 standards. Two rated speeds have been selected to meet the criteria in CIBSE Guide D: 2010, Section 3.5.7.[3] All inter-floor distances were assumed equal and 3.75 m high.
The other important variable is the population of each floor. For the purpose of this research, the maximum handling capacity of the building was set at 12.5% of the total population (considered by CIBSE Guide D and the British Council for Offices as a starting point for most traffic designs for offices). A population per floor was obtained from the value of population that can be served by a specified lift installation. All floor populations were assumed equal. The formula for the calculation is shown in Equation 4.9 of the Elevator Traffic Handbook.[4]
Lift Data
As already stated, the simulations considered simple duplex installations. Initially, rated loads of 630, 1000, 1600 and 2500 kg were selected to span the common range of lifts installed in offices. Later, lifts with rated loads of 450 kg were added to accommodate residential buildings. Other typical lift data, such as door-operating times, start delays, single floor flight times, acceleration values, jerk values, etc. were selected. (Data available on request.)
Passenger Data
The passenger parameters that influence the behavior of the installation are passenger transfer times, passenger mass and car capacity factor (%).
Traffic Patterns/Templates
Traffic patterns are defined by passenger arrival rates at specific floors and passenger destinations. This activity is set to occur in 5-min. periods. ELEVATE can customize the passenger traffic flow by defining a number of periods, each with its own set of arrival rates (in persons per 5 min.) and destination probabilities for passengers traveling from each floor to create benchmarking templates. Many of these are described in CIBSE Guide D: 2010, Chapter 4.[3]
For this research, three different templates have been used. The latter two were at the request of WG 10:
- Siikonen full-day template:[5] This is based on a sample multitenant office building in Paris.
- Strakosch residential all-day traffic template:[6] The profile is based on the requirements of a residential building.
- CIBSE Guide D: 2010: A third traffic profile based on CIBSE Guide D: 2010 was provided by Dr. Richard Peters.
The resulting Total Passenger Activity graphs can be found in the ELEVATE manuals and Chartered Institution of Building Services Engineers (CIBSE) guide, respectively.
Simulation Execution, Data Treatment and Definition of Templates for Collecting the Results
Initially, the simulations were performed on 24 systems, which had three different numbers of floors (five, 10 and 16), each with four rated loads (630, 1000, 1600 and 2500 kg) and two rated speeds (0.63, 1.0, 1.6 and 2.5 mps, combined in pairs) and a collective (COL) traffic control system. The simulations used the Siikonen all-day (12-hr.) template, which was considered the most representative one, as it has up/down/inter-floor traffic and includes a lunch break (CIBSE Guide D: 2010, Section 4.6[3]). Although it corresponds to an office building, it can emulate other building types.
In order to consider the four different levels of intensity of use, four runs were carried out in the 24 different buildings with floor populations at 100%, and reduced by one-half, one-fourth, and one-eighth, representing intense, heavy, medium and low use, respectively. In this way, there were 96 sample systems.
The simulation was run only once, but as there were two lifts in each installation, the results obtained for each simulation corresponded to two cases. This gave 96 X 2 = 192 cases. From the reports automatically provided by ELEVATE, it was necessary to obtain the following information: average travel distance, average car load, idle/standby time in different time slots (1, 2, 5, 15 and 30 min.) and the number of starts.
The standard version of the ELEVATE software provides spatial plots and a corresponding table of data. The processing of the full table provided:
- Total running time
- Total standing time
- Times the lift is stationary by time bands (< 1, < 2, < 5, < 15, < 30 and > 30 min.)
- Total number of starts per day
- Average distance traveled
The details of the car load transported can be extracted from the graph named “Car loading on arrival at home floor” provided by ELEVATE, which shows the average and maximum values (in percentage of rated load) in 5-min. time slots. Depending on the purpose of a study, this average information can be sufficient, as it allows the calculation of the average load transported by a lift in a certain period. However, it is not precise enough for an accurate calculation, where it is necessary to know the number of occurrences of each possible trip (defined by direction of movement, distance traveled and load carried), which are the parameters necessary to calculate the actual energy consumption.
For this reason, a Microsoft® Office® Excel macro was created to analyze the detailed information related to the passenger trips. A later processing of this database made it possible to create the matrix of occurrences, from which the average distance traveled and average mass transported in loaded trips can be easily calculated. The number of empty trips could be calculated as the difference between the total number of starts provided by ELEVATE automatically in the Excel sheet and the final number of standard trips. In this way, they could be accounted for with view to the calculation of the average load, but not for the calculation of the average distance travelled, as the origin and destination of these empty trips were unknown. The software was customized to obtain this information.
The 96 sample buildings (192 cases) were simulated again at the end of these improvements, and the deviation in the average travel distance showed an error of approximately 5% compared with the first estimation, which had supported the first drafts of the work for the International Organization for Standardization (ISO) standard. Later improvements to the analysis software further improved the results.
First Analysis of Results
From the first set of simulations carried out, it was concluded that, as expected, the number of starts increases with intensity of use. This caused the predictable effect of extending the running time at the expense of the standing time and modifies the distribution of the trips in the different idle/standby time slots, depending on the number of starts. The trends also showed that lower traffic levels would produce even lower average car loads and longer travel distances.
The presentation of the results to the WG 10 group of lift experts developing the draft of ISO/DIS 25745-2[7] raised questions:
- For example, how good is the traffic template? Besides the very good office template used (Siikonen), ELEVATE also provided a reasonably representative residential pattern (Strakosch) and the new one based on CIBSE Guide D: 2010, Figure 4.1.[3] The simulations were repeated with additional traffic patterns to assess their influence.
- The need to add systems with lower-capacity cars (450 kg) and lower rise (three-fourths stories) in order to accommodate residential buildings. Although the addition of such low-rise buildings would lead to significant errors in the simulation model (owing to the poor statistics), these were simulated for completeness.
- The desire to have higher usages above 2,000 starts per day. It has often been stated that the number of starts in Asian countries is considerably higher than those in Europe, so higher usage categories with the number of starts above 2,000 starts per day were requested. Although this might indicate an incorrect traffic-system design, it was included.
- A wider range of traffic intensities, to six.
- More statistical data were needed to produce regression graphs.
In order to give response to all these questions, the range of simulations was increased.
Analysis of Results
In this section, the final plots obtained after the software and templates were updated are presented, and the results and tendencies observed are explained. They contain the results of the final set of sample installations, which were increased to achieve the six usage categories requested by WG 10.
Effect of the Traffic Pattern on Number of Starts
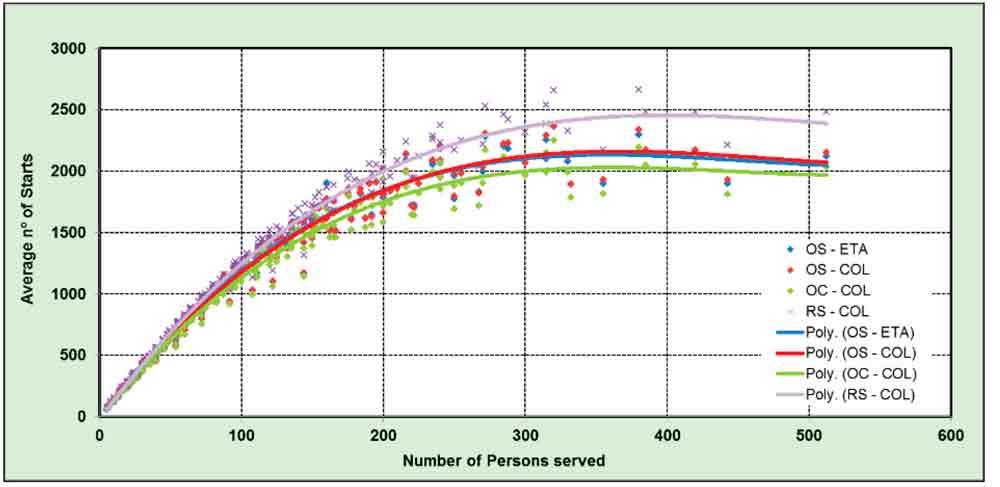
The number of starts in the simulated period increases with the population served per lift (Figure 1). The results are almost identical for the COL and estimated time of arrival (ETA) traffic-control algorithms. The values obtained for residential buildings using the Residential (Strakosch) template are higher, followed by the Office (Siikonen) template and the Modern Office (CIBSE) template. However, it has to be noted that the simulated period differs (slightly) but should have a minor effect, depending on the traffic template used:
- (RS) Strakosch Residential 14 hr.
- (OS) Siikonen Office 12.25 hr.
- (OC) CIBSE Office 12 hr.
If a plot of average number of starts per hour instead of the absolute value were presented (Figure 2), then the different lines would become closer together with the Modern Office template, producing the highest number of starts per hour, and the Residential one the lowest.
- CIBSE: 1.04 starts per hour/person
- Siikonen: 0.96 starts per hour/person
- Strakosch: 0.88 starts per hour/person
The first part of the graph shows a linear dependence, which becomes a nonlinear (polynomial of degree three) at the maximum values with around 2,200 starts. After reaching this maximum value, the curve begins to fall, which indicates the lift installation has reached saturation.
Although, logically, it might be thought that an increasing population demand (persons served) would result in the number of stops limiting to a maximum, the real effect is that they fall. The reason seems to be that at higher demand levels, the lift installation has reached the limit of its traffic-handling capabilities. The result is a traffic buildup in the lobbies: passenger boarding/exit times increase, and the transportation becomes inefficient. These inefficiencies can be also observed in the plots showing the distribution of the time spent in the different operating conditions. However, further research might be carried out with additional samples to confirm the validity of this reasoning.
The graphs confirm that the traffic template (traffic pattern) does not make a large difference and show that the values are similar for residential and office buildings. A further important conclusion is that the higher number of starts reported from Asian countries can only be achieved if the operational time is increased from 12-14 hr. to include nighttime activity at high levels.
Average Distance Traveled Versus Average Number of Starts
The average distance traveled decreases with the number of starts (Figure 3). It ranges from a maximum average of around 50%, except for very low-rise buildings (see rectangle in the figure), and a minimum of 20% for very intense use. If the results were represented as average distance versus number of starts per hour, the difference between traffic templates would be small.
Lift professionals frequently state that intuitively (from their own experience), the average distance traveled should be longer. A further analysis was carried out to check this impression. Could it be caused by the fact that the observers only see this effect when they are traveling in loaded cars? The graph obtained (Figure 4) confirms that the average of distance is heavily influenced by the intensity of use, which drastically reduces this average.
Average Load Transported Versus Average Number of Starts
A plot of average load transported versus average number of starts shows an intense “swarm” of points, which strongly indicates that the average load transported depends on another factor and not only on the intensity of use. Looking at the results for lower intensities, where the points are more concentrated, five groups of points can be seen, which coincide with the different rated capacities analyzed. Another finding is that, as expected, the load increases with the population handled. The range of variation is large (5-25%). However, by taking the median values, the results do not change very much with the traffic template used (a maximum of 3% for high numbers of persons served) or the traffic-control algorithm. This can be more clearly observed in Figure 6, where only the results for 1000-kg-capacity cars are shown.
If the data is plotted for one single template and the results grouped by car capacity, a much clearer tendency can be seen of the load increasing with the use with delimited range bands, according to the car capacity (Figure 7).
Distribution of Running, Idle and Standby Times Versus Average Number of Starts
The average time between trips shows a very clear exponential tendency, with its maximum at a very low building occupancy. It can be observed that only for a very low number of starts does the lift spend more than 5 min. stationary between consecutive trips. This is a result of great importance, as currently most lifts switch into a lower-energy-consumption mode after this time. (ISO 25745-1 defines standby as commencing after 5 min. of inactivity.) This leads to the supposition that the standby status may not be reached during the daily operation time and just during non-operating hours.
If, for any specific number of starts, the running, idle and standby times are summed, the results will always be 100% (Figure 8).
In Figures 9-11, it can be observed that the time spent by the lift in running conditions increases with usage, reaching a maximum of 50% for a high activity (2,000 starts). When the number of starts increases above this quantity, the lift loses efficiency, as already stated. The time in non-running conditions is split into “Idle” (Figure 10) and “Standby” (Figure 11). The plot of the idle time (Figure 10) also shows the inefficiency of passenger handling when increasing the number of starts above 2,000, as the time that it is stationary increases again. The standby mode (lower energy consumption) will be activated after the lift has been inactive for 5 min.
Distribution of the time spent by the lift running or in stationary conditions during the daily operation time is shown in Figure 8. The graphs clearly show (in accordance with the tendency of the average time between consecutive trips, Figure 12) that for high traffic demands, the lift does not have time to switch into standby very often; the time being spent in this low-energy state is less than 10% for more than 500 starts.
Summary
Table 1 summarizes the results of the research, many of which have been adopted by WG 10. Note there are six usage levels. Surprisingly, the rule of thumb assumed in ISO 45745-1 of an empty car that travels about half the distance between terminal floors is close to reality in many circumstances.
Further Work
The ISO 25745 series of standards only considers a single unit. From the results obtained, the two simple traffic-control algorithms do not seem to have influenced the results for the type of buildings analyzed. However, to be more scientifically rigorous, work on other traffic-control systems will be undertaken – in particular, the hall-call allocation traffic algorithm. This algorithm differs significantly with other dispatchers. The simulations should also be run for groups of at least four, rather than two, lifts. The effect of unequal distribution of floor population/demand should also be researched.
The effect of an express zone should be analyzed in more detail to allow the method to be used for zones located high in the building. It is hoped these results will be validated by collaboration in the industry, as most real-life measurements are carried out by lift companies.
Conclusions
The research study detailed in this paper is based on the results of thousands of simulations, which are considered as if they were experimental data. However, simulation is notorious for delivering answers that do not occur in real systems, but these answers will be as good as the traffic pattern used in their production. The use of simulation tools for predicting the value of parameters with view to the calculation of the energy consumption of lifts seems to be the most accurate method currently available.
Although average tables (calculated for standardized buildings to cover the scope defined in ISO 25745) are precise enough for standardization purposes, for a better prediction in any commercial offers, it is recommended that every specific case is calculated, taking into account the real characteristics of a building and the lift and the most suitable traffic pattern.
Acknowledgments
The authors wish to express their most sincere thanks to Vega Rodrigálvarez from Instituto Tecnológico de Aragón for her support in computing related issues; Dr. Richard Peters for allowing the use of his ELEVATE software under a research license, answering the many questions that arose and making some changes in order to facilitate this work; and to the all members of the ISO/TC 178/WG 10 Working Group Technical Committee: Lifts, Escalators and Moving Walks, from whose huge knowledge and experience this work has profited. A special mention is made to Dr. Gerhard Schiffner (ThyssenKrupp) for many searching and stimulating comments and Richard Fargo (Otis), who convened a task force providing many of the objectives for this work. The first author wishes to thank the CIBSE Lifts Group for a travel bursary to attend a WG 10 meeting.
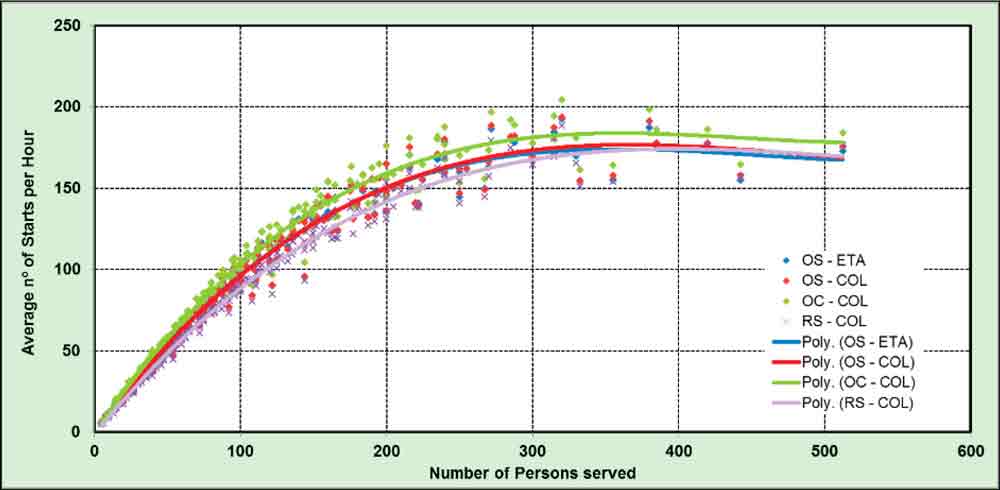
Figure 2: Average number of starts per hour versus number of persons served (all patterns) 
Figure 3: Average distance traveled (all patterns) 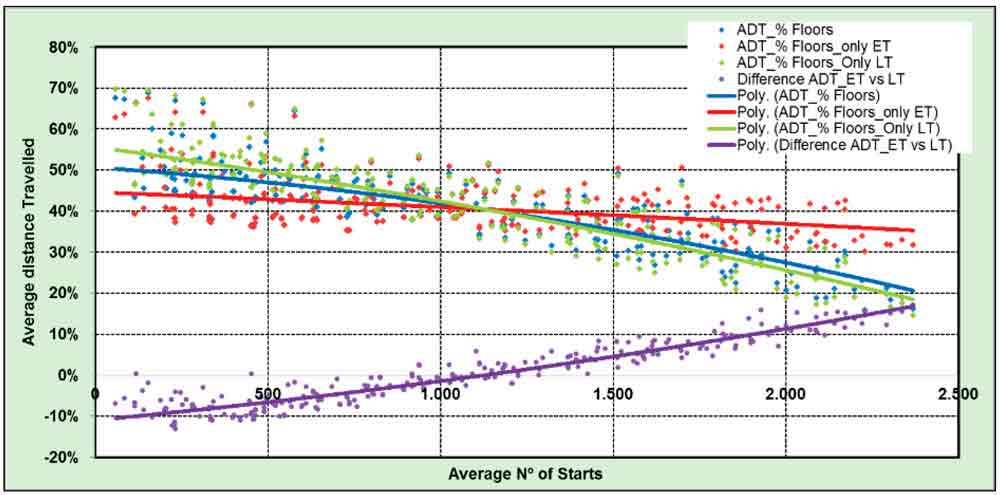
Figure 4: Average dis-tance traveled (% of build-ing height; ADT); average, empty trips (ET); loaded trips [LT], difference 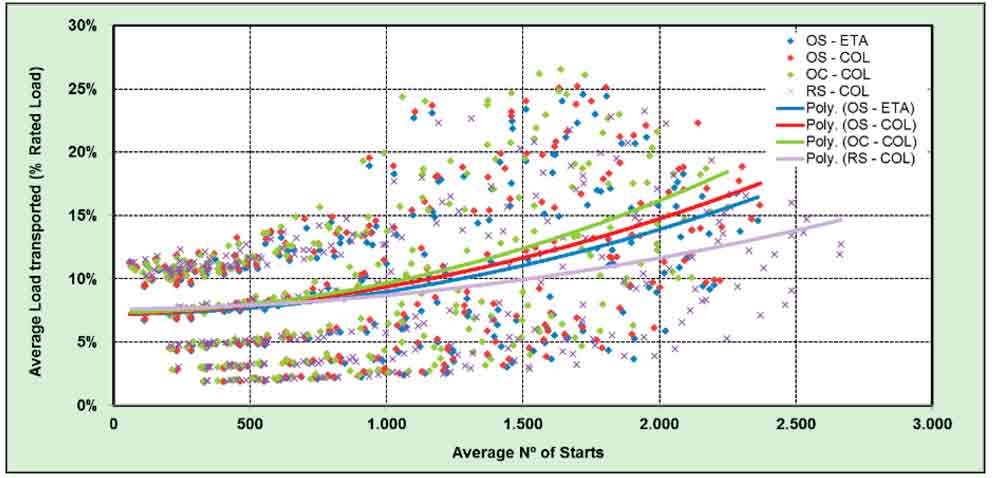
Figure 5: Average load transported (% rated load, all patterns) 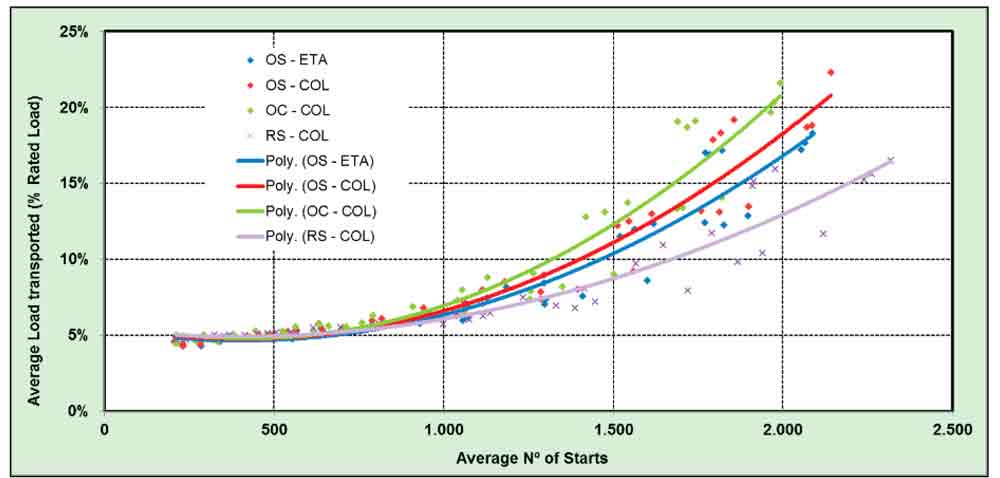
Figure 6: Average load transported (% rated load) for 1000-kg-rated-load lifts 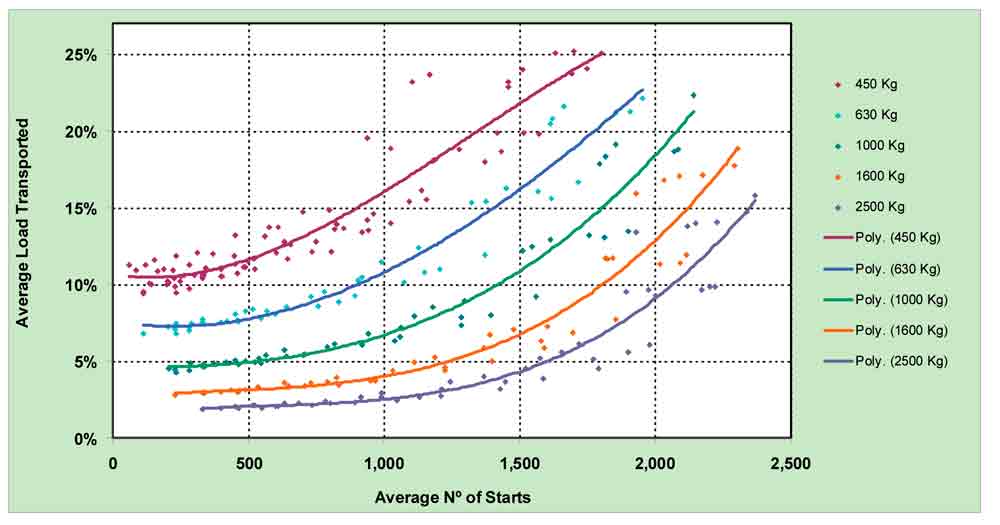
Figure 7: Average load transported versus number of starts (grouped by car capacity) 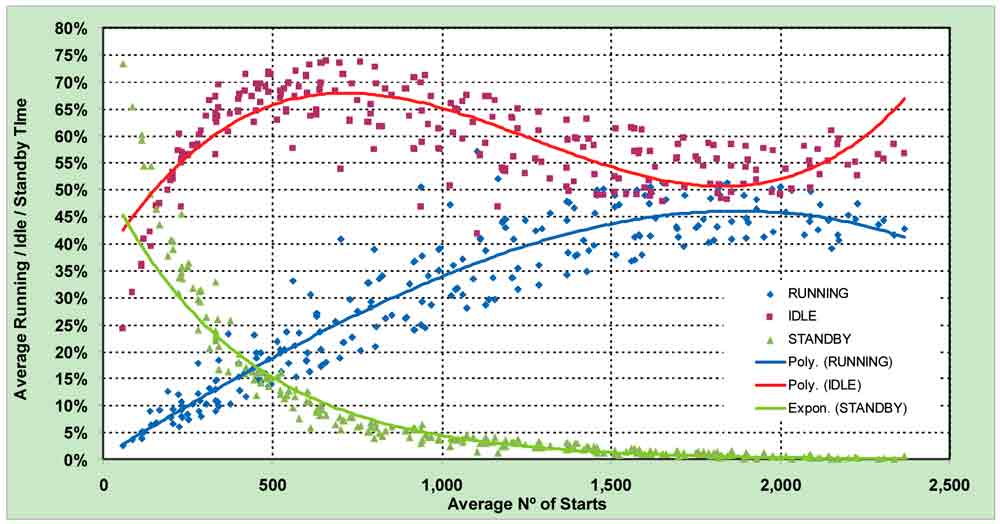
Figure 8: Distribution of time in different operational modes versus number of starts 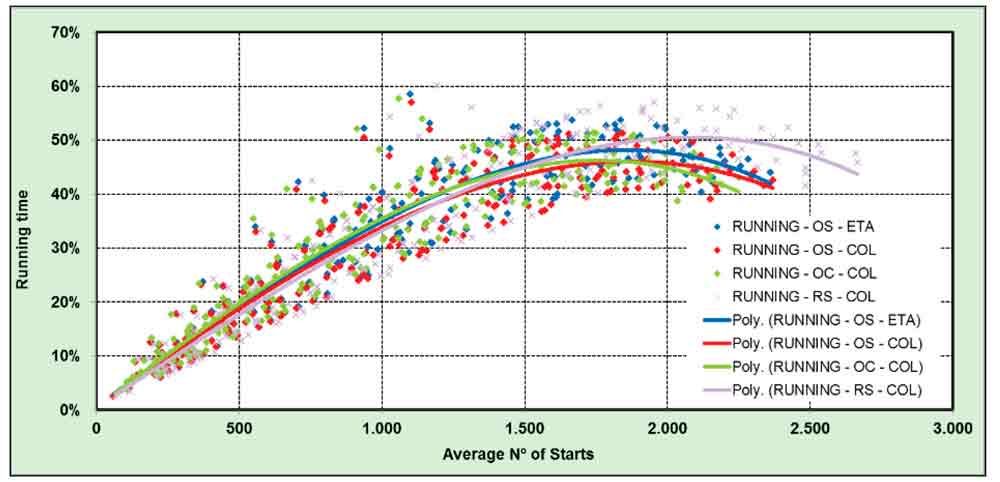
Figure 9: Distribution of running time during nor-mal operation 
Figure 10: Distribution of idle time during normal operation 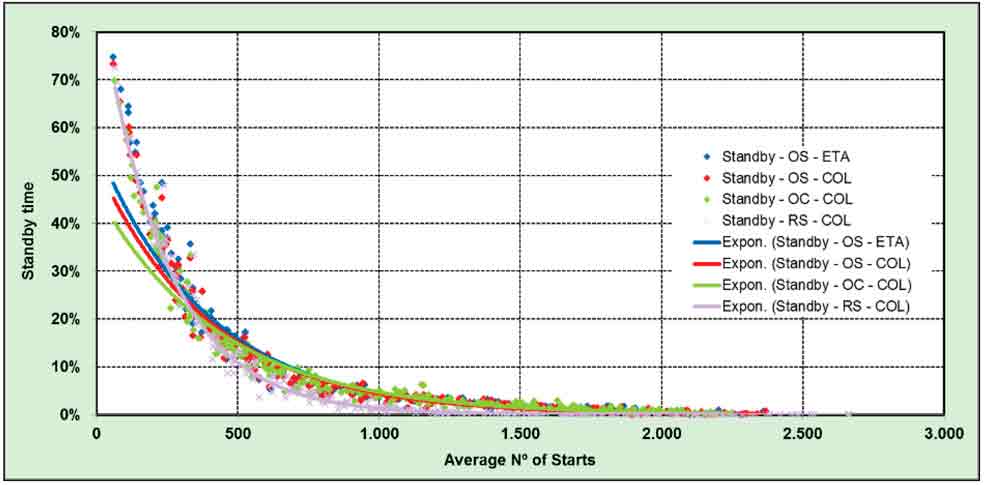
Figure 11: Distribution of standby time during nor-mal operation 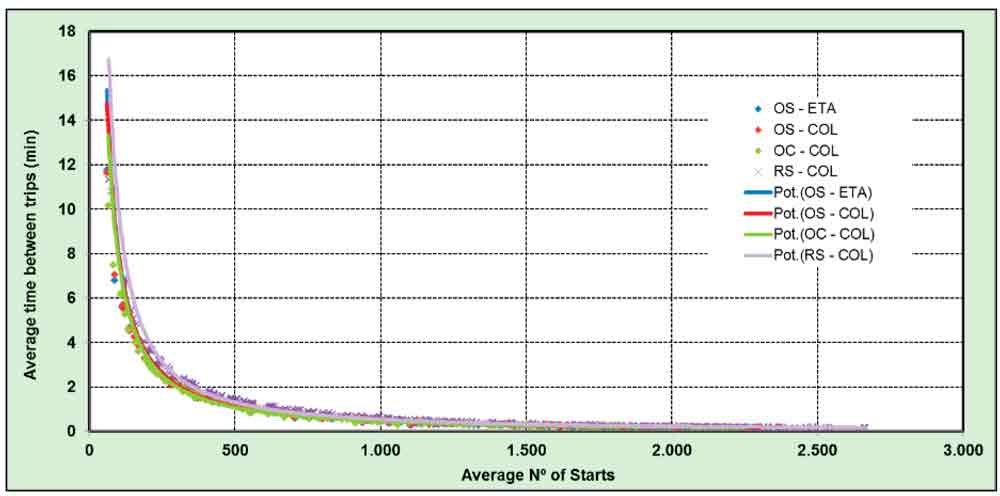
Figure 12: Average time between trips (minutes) 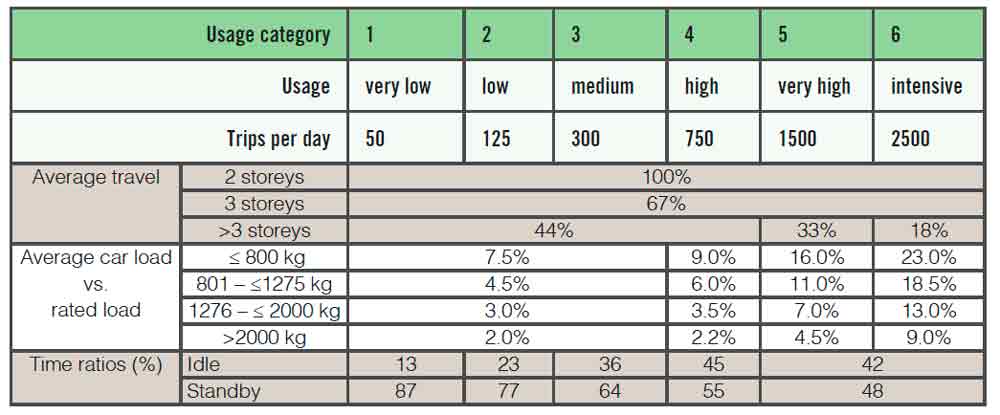
Table 1: Summary of results
References
[1] ISO 25745-1:2012 – Energy Performance of Lifts, Escalators and Moving Walks, Part 1: Energy measurement and verification.
[2] VDI 4707-1:2009 – Guidelines for Lifts: Energy Efficiency.
[3] CIBSE Guide D: 2010: Transportation Systems in Buildings.
[4] Barney, G. C. Elevator Traffic Handbook: Theory and Practice: Taylor and Francis, 2003.
[5] Siikonen, M-L. “On Traffic Planning Methodology,” Elevator Technology 10: Proceedings of Elevcon 2000.
[6] Strakosch, G.R.: The Vertical Transportation Handbook, 1998.
[7] ISO/DIS 25745-2:2012 – Energy Performance of Lifts, Escalators and Moving Walks, Part 2: Energy Calculation and Classification for Lifts.
Get more of Elevator World. Sign up for our free e-newsletter.

