Environmental Impact of Lifts: the EPD
Dec 5, 2022
Your author takes an in-depth look at rules, processes, geographical variations and trends.
by Giuseppe Iotti
The environmental product declaration (EPD) is a voluntary document with which a company or organization transparently discloses the environmental impact of the life of its products or services. It is not only about energy consumption. In this way, a product’s entire environmental sustainability is assessed and declared.
Issuance of an EPD follows codified rules called product category rules (PCR) and the related general program instructions (GPI). These documents are registered in the framework of the International EPD System and can be consulted in the library at EPD International. Specific rules for lifts were published in 2015 and renewed in 2019 after many public consultations.[1] Based on these rules, some authorized program operators — such as Sweden’s EPD International AB, Netherlands’ Stichting and Spain’s Aenor — work in the lift field. To process an EPD, it needs to follow the system of international standards for environmental management starting from ISO 14001, involving ISO 14040 (principles for life cycle analysis (LCA), ISO 14044 (guidelines and requirements for LCA), ISO 14025 (environmental declarations and labels) and the EN 15804: 2019 standard on EPD and PCR specific to sustainability in buildings. Some EPDs for lifts have been released out of the framework of the codified PCR, but still comply with the applicable rules of ISO 14000.
The first step is the univocal definition of the product in question — the lift — classified according to the UN product list with the code CPC 4354. Then, there is the detailed definition of the specific lift: nominal capacity, speed, travel height, number of stops, type (for example, electric machine-room-less [MRL]); category of use foreseen, according to ISO 25745-2 (energy performance of lifts – energy calculation and classification of lifts), with the consequent average number of daily trips; its recommended application, i.e., the type of building for which it is intended; the number of days of service foreseen; the energy efficiency class, always calculated on the basis of ISO 25745-2; the geographical area of reference; and, last but not least, the declared hypothesis of duration of the product life cycle (PLC).
The basic document assumes a period of use of 25 years, but the manufacturer can declare a different value (which has been done by some) and because it also depends on the characteristics of the different markets, including the fact it can be better economically to completely replace a lift every “X” number of years. The definition of the expected duration of the PLC is also essential because the longer or shorter use phase is among the main ones in determining the environmental impact and, in particular, the electric power supply generally produced by emitting CO2 (even if the lift itself does not emit any) for the entire designated period. The longer the life of the product, the better it would be, as long as it continues to operate efficiently and safely, unless replacement involves the installation of a new lift that is really better from an energy point of view than the old one.
The geographic area of reference is important for both the use and production phase of the lift, locations that can be different in the two phases. It determines the mix of materials and energy used (which can change over time — so much so that EPDs have a time limit), and is necessary to address some of the environmental indicators of the impact of the lift in its LCA we will see below.
The contribution of the various energy sources — especially that of renewable energy — used in the area of reference by the lift is important. It is understood that using solar, hydro or wind power is far better than burning coal, gas or diesel in power plants. As for the production of nuclear energy, it creates other impacts, but does not emit CO2 directly, as there is no combustion.
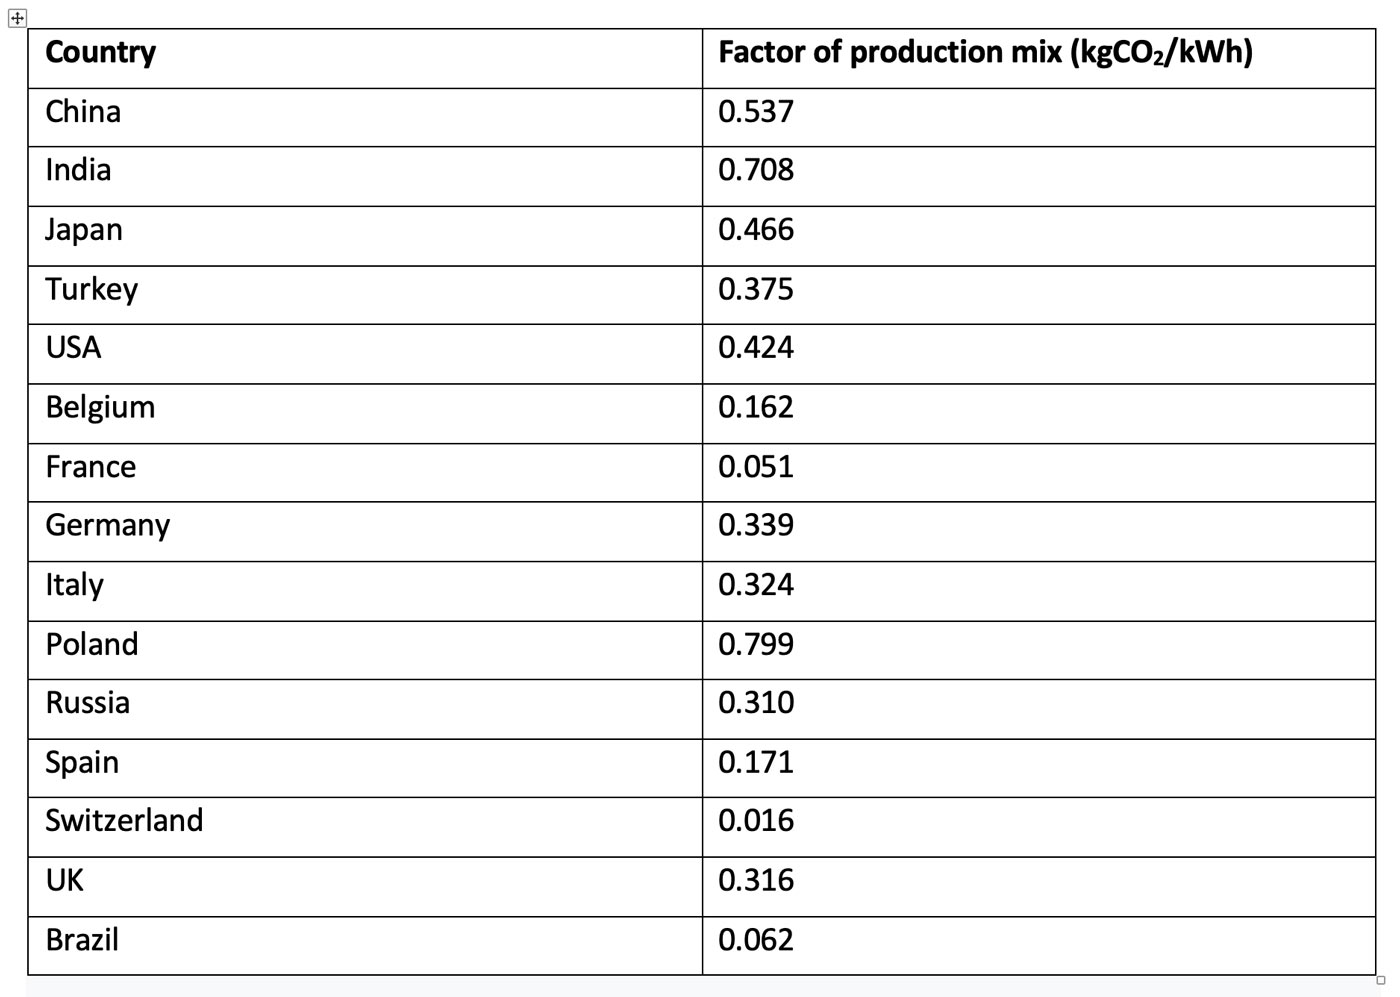
There is a synthetic index that expresses this data, which is the factor of the production mix in kg of CO2 emitted per kWh of electricity produced — the lower the better. In the following table, we see the different values collected in March 2022[2] from some countries of the world.
National data vary significantly due to the energy choices of different countries. For example, the situation in Italy is more than six times worse than in France, but more than twice better than in Poland. This also depends on the energy sources present and exploitable in their own or neighboring territories and takes into account economic and environmental constraints.
National data vary significantly due to the energy choices of different countries.
Some areas have more sun, more wind or more possibilities and will to build hydroelectric basins or exploit other renewable sources. Others that have access to coal, gas or oil, or can more easily import them. Still others have made a decisive nuclear choice, which some, on the contrary, have completely excluded. Poland, India and China burn a lot of coal in percentages. For example, while France has focused on nuclear power and Spain on solar and renewables in general, Italy is, let’s say, halfway between gas and renewables (in particular hydroelectric) and uses little coal and no nuclear power. Some EPDs indicate different values in the table (for Italy, for example, 0.42), based on other estimates.
Production of a lift and its components is different, for example, in Switzerland versus China. Environmentally, it is almost twice as beneficial to produce in Spain rather than Italy, from the point of view of the kg of CO2 emitted per kWh of electricity used. Manufacturers can operate on this factor, deciding where to produce, and their EPDs will reflect these choices.
Another decisive aspect is the place, or places, where it is declared that the specific lift is installed and will work. The same lift working in Italy, as far as we have seen, determines CO2 emissions during use that are roughly double compared to if it worked in Spain, but less than half that in Poland.
In their EPDs, some producers (with regard to the use phase) declare an average energy mix that refers to the geographical distribution of their sales. It is not the best possible choice. That would be to adapt the declaration for each lift to the actual situation of the country of installation. Doing so, however, would force the processing of a large number of different documents — a considerable burden. This, however, causes us to reflect on the rather relative value EPDs can have in time and space.
It would not make too such sense, for example, for a company without particular relations with France to locate the lift chosen for the EPD in France, with its favorable energy mix that allows it to declare a lower energy impact in the use phase. If an identical lift is, instead, installed in Italy, the impact due to the energy mix will be sixfold in that phase, unless the situation changes (hopefully) for the better over time. For these reasons, EPDs make it clear in their introductions that they are comparable only if they refer to exactly the same conditions. But to those who receive them, all these conditions should be made clearly visible and easy to understand so the client does not end up comparing products incorrectly.
The lift, like any other product, has its own life cycle. Its assessment includes the following modules:
- A1: supply of raw materials
- A2: their transport to the factory
- A3: manufacturing (of the components or of the entire lift)
- A4: transport to the construction site
- A5: installation
- B1: use
- B2: maintenance
- B3: repair
- B4/B5: any modernization or replacement
- B6: energy consumption during operation
- C1: dismantling
- C2: transport of the dismantled materials
- C3: treatment of waste for reuse, recovery or recycling
- C4: waste disposal
- D: reuse, recycling and recovery of waste in terms of net benefits
Phase B7 (water consumption) is not considered, as the lift does not consume water. Modules A1-A3, C1-C4 and D are mandatory, with few exceptions, but a “cradle to grave” EPD contains them all. Some companies with their own factories specify the data related to phase A3 that distinguish between suppliers and their own production. For small- and medium-sized enterprises (SMEs), it can be assumed data from A1 to A3 should be collected mainly from suppliers.
A more synthetic subdivision can be made, dividing the phases into: Upstream (A1, A2 and possibly A3 for suppliers), Core (A3) and Downstream (all the others). D is a “benefit,” that is, the calculated data is subtracted from the environmental impact of the product.
The description of the materials (in kg and as a percentage of the total) of which the specified lift is made follows in the EPD:
- Ferrous metals
- Non-ferrous metals (i.e. aluminum, copper)
- Plastics and rubbers
- Other inorganic materials (i.e., concrete, glass)
- Organic materials (i.e., paper, wood)
- Lubricants, paints, coatings, adhesives, filling materials
- Electrical and electronic equipment
- Batteries and accumulators
- Any other materials
The composition and weight of the packaging may be specified, usually mostly in wood, followed by cardboard and plastic. Some manufacturers specify environmental characteristics such as FSC (Forest Stewardship Council) certification for cardboard and PEF (Programme for the Endorsement of Forest) certification for wood.
From a quantitative point of view, an MRL electric lift (type for which more EPDs have been issued to date) is largely (at least two-thirds) made of ferrous materials if the counterweight is made of concrete or around 90% if it is in ferrous materials. If the counterweight is in concrete, the inorganic materials in a standard lift of 630-kg capacity with five stops reach 30%, including a mirror in the cabin. As the stops increase, the percentage of iron increases. Non-ferrous materials and plastics represent single-digit percentages and other materials are under 1%. A minimal percentage (less than 0.1% by weight) includes lead, boric acid and boric anhydride, which are found in electronic components and are dangerous substances. The procedure allows those reporting to neglect up to 5% of the total.
In some countries, it may be mandatory to mention certain substances in the declaration. Although there is, today, a common vision at the international level about which substances are considered polluting or dangerous, relative national legislation may not yet be completely homogeneous in this regard. Among these elements there may be VOCs (volatile organic compounds), but ISO 15804 still requires the description of the possible presence of SVHC (substances of very high concern) — a list drawn up by the European Chemicals Agency (ECHA).
Environmentally, it is almost twice as beneficial to produce in Spain rather than Italy, from the point of view of the kg of CO2 emitted per kWh of electricity used.
Some EPDs detail transport phases, specifying whether or how much of transport is done by truck, ship or other means, as well as respective fuel consumption and average distances traveled.
The definition of the functional unit (FU) follows. It is calculated starting from the procedures indicated by the ISO 27425-2 standard and is a value expressed in tons per km (tkm), physically, a transport of a load for a vertical distance. It is useful because the validity of an EPD can be declared extended to (reasonably) different ranges of capacity, speed and number of floors. The results of the LCA can, thus, be adapted to the variants. The value is obtained by calculating the average load of the car and the average distance traveled for each run. Then, results are multiplied by the runs that are assumed to be carried out during the life cycle of the product, i.e., five years. The average load during the life of the system in this case of 630 kg, five stops and 12 m of travel, is estimated at 7.5% of the nominal load from Table 3 of the standard (47 kg). If the lift is planned to be located in category U2 as defined in Table A1 of the standard, that is, in a residential building of 20 apartments, with foreseeable low traffic, i.e., an average of 125 trips per day, and the average travel on a total of 10 m is 4.8 m, in one year, it is estimated the lift travels 4.8 X 125 X 365 = 219.000 m, and in 25 years 5.475 km. The FU will then be 0.047 X 5.475 = 237.33 tkm. It is also possible to compare the total mass of the system (for example, 2,600 kg for a lift with a capacity of 630 kg and five stops) with the tkm; in this example, it will be 10.96 kg/tkm. If the packaging is taken into account, this value increases by about 10%.
The environmental impact of the lift, like that of other products of industrial systems, is assessed according to the standards applied in the EPD with the following indicators:
- Potential for depletion of abiotic elements (ADP-elements), expressed in kg Sb (antimony) equivalent. These are raw materials whose consumption at current rates does not appear sustainable. That is, they are subject to scarcity.
- Potential for abiotic depletion of fossil fuels (ADP-fossil), expressed in MJ (megajoules). This concept is similar to the previous one, referring to oil, gas and the like.
- Acidification potential (AP), expressed in kg of SO2 (sulfur dioxide) equivalent. It is an effect of pollution caused by industrial activities, transport and, in general, the use of fossil fuels. It describes how much acid deposition in plants, soil and surface waters is caused by air pollutants that convert to acid.
- Eutrophication potential (EP), expressed in kg of PO43- (phosphate group) equivalent. The excess nutrient in the water causes the proliferation of algae and various plants, which can result in oxygen depletion, unbalancing the environments in which plants and animals live, even causing their death.
- Global warming potential (GWP) due to the greenhouse effect, expressed in kg of CO2 equivalent. It is a relative measure of how much heat the greenhouse effect traps in the atmosphere and refers to a given time interval.
- Photochemical ozone creation potential (POCP), expressed in kg of C2H4 (ethylene) equivalent. It is connected to summer smog in an urban environment with an excessive concentration of pollutants. While ozone has the positive effect of protecting us from ultraviolet rays in the upper atmosphere, at ground level it is a pollutant that is dangerous to health, attacking the airways and lungs.
- Ozone depletion potential (ODP), expressed in kg of CFC 11 equivalent. CFC-11 (trifluoro chloromethanes), with halon and HCFCs (hydrochlorofluorocarbons), destroy ozone in the upper atmosphere.
The heart of the EPD is represented by the environmental performance data on the use of resources with respect to these potentials. As for primary energy, which is divided into renewable and non-renewable, the phases largely prevalent in consumption are those of manufacture and use. This also applies to materials, which are mostly renewable resources. The exhaustion of inorganic elements is very prevalent in the supply of raw materials, of course. That of the fossil elements (energy carriers) is there, but also in the use phase. Acidification is also determined mainly in the first phase, such as the photochemical creation of ozone, and, like eutrophication, which, however, also affects that of use. Therefore, there are two really impactful phases in the history of the lift, without neglecting transport to the construction site, maintenance and waste treatment. Determining the production of waste is still in the first phase, to a lesser extent that of use and dismantling at the end of its life.
Also, in terms of carbon footprint (in kg CO2 equivalent), the prevailing phases are those of production and use. In an EPD relating to the standard, the first is estimated to determine two thirds of the total and the second approximately 30%. By counting phase D, we may have about 13% recovery of kg CO2 from waste.
The environmental performance data are represented in the form of a table, both in absolute value and in relation to each tkm, so they can be extended to the variants of the basic lift. Two tables are issued — one referring to environmental impact and one to resources consumption. A table then describes the quantities of waste produced during the various stages of life, in absolute terms, and for each tkm, and splits hazardous waste from those that are not. Some, then, specify different end-of-life scenarios, referring, for example, to Eurostat statistics for Europe in general or national statistics where available. A prudential (pejorative) hypothesis for the rest of the world is to consider that all waste ends up in landfills.
References
[1] S. Iqbal and N. Minkov, “Calculating, Quantifying and Reporting ‘Green,'” ELEVATOR WORLD, April 2014
[2] Carbon footprint
Get more of Elevator World. Sign up for our free e-newsletter.


