Estimating lifetime of elevator ropes
Apr 1, 2020
Abstract
by Dr. M. El Messiry
The object of this article is to find relationship between the calculated life time of steel rope DRAKA-25DT, including it’s important physical characteristics such as diameter, factor of safety (SF), and the number of complete trips and shape of grooves in traction sheave, i.e. (V) shape and its angle (), or semicircular shape with undercut angle (
). In addition; the usage density in building, which vary between very light …. up to very heavy density according to (BS EN ISO 25745-2 standard), The number of bending (complete round trips) after which the rope must be replaced.
1- Introduction
The regular inspections, which carry out by competent person, consider up till now the basic method to replace the suspension ropes of elevators. The inspection gives clear data about the wear which happened in the ropes.
The data includes:
The maximum allowable reduction of nominal diameter of the ropes, wires break criteria, the ropes showing rough, break of crown wires per lay strand,
Methods of distribution break wires (unequal break, side by side … etc.).
Assuming that there are a relation between the bending of the rope (corresponding to the complete round trips), suspension ratio of the ropes (1:1) or (2:1), duty cycle of operation, usage density (including the types of building), type of warp of rope (single or double), a mathematical estimation can be obtained in the form of tables followed.
2- Number of complete trips/day, usage category
The number of complete trips per day depend on usage category (which is vary from (1) to (5), corresponding to usage intensity very low up to very high respectively.
| Usage category | 1 | 2 | 3 | 4 | 5 |
| Usage density | Very low | Low | Medium | High | Very high |
| Number of trips/day Typical range | 50 <75 | 125 75<200 | 300 200<500 | 750 500<1000 | 1500 1000<2000 |
| Usage category | Types of building/(days per week) |
| 1 | Small residential blocks (7), disable access (7) |
| 2 | Residential care (7), goods (5), library (6), entertainment centers (7), stadia (intermittent) |
| 3 | Office car parks (5), general care parks (7), university (5), residential (7), hotels (7), low height hospital (7), shopping centers (7). |
| 4 | Office (5), airport (7), high rise hospital (7). |
| 5 | High quality office, and similar. |
3- Estimation of life time of steel ropes
3-1 Life time of steel rope related to usage density
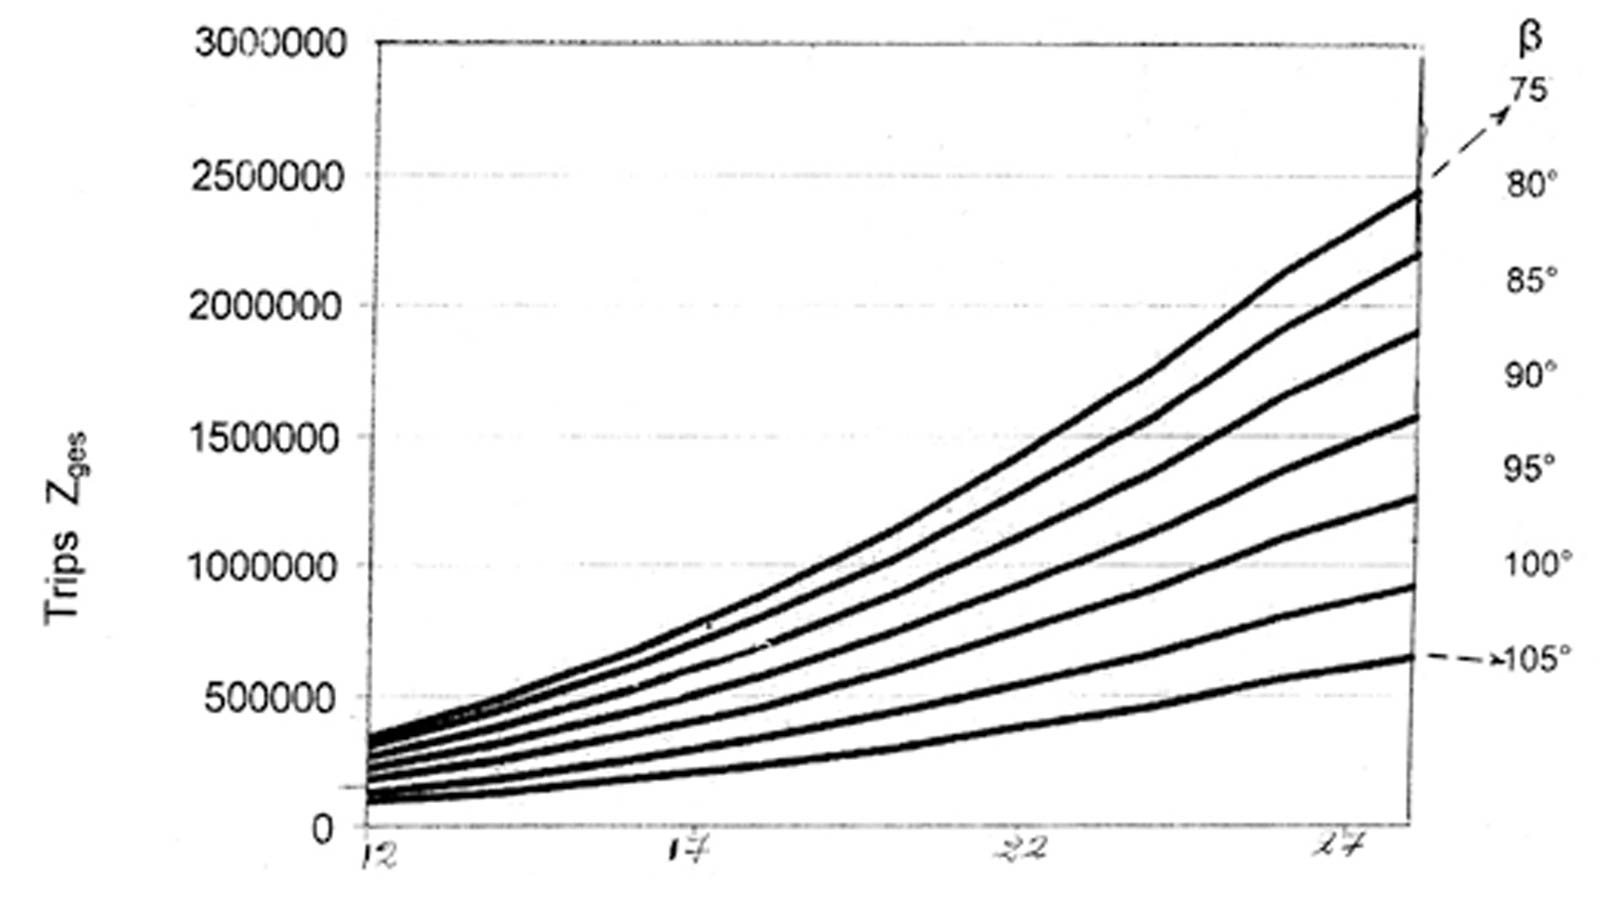
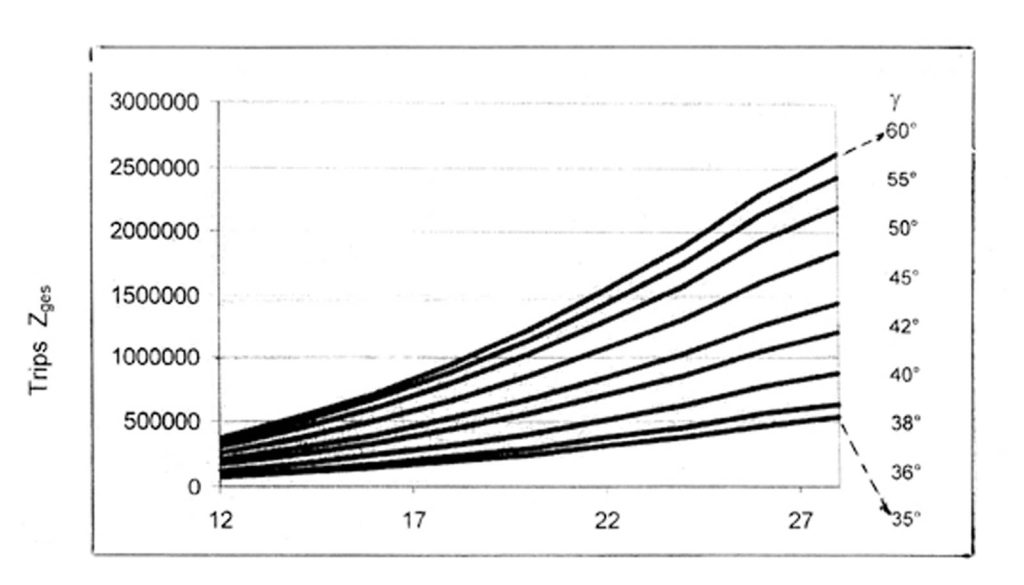
The relationship between the life time of rope and usage category (usage density) are shown in table (3). The nominal diameter of rope is (8 mm), and safety factor equal (12). The traction sheave has hard (V) shape groove, with groove angle ( = 40°). The actual number of complete trips is given from manufacture Fig [1-(a)].
3-2 Effect of factor of Safety on life time of rope
The calculations were carried out with the same condition mentioned in (3-1) except the factor of safety change from (12) to (16). The results of calculation are shown in table (4), all columns of table (4) are typical as in table (3) except the two last columns, (the actual number of trips/year and the life time of the rope). The results of calculation are given table (4).
3-3 The effect of the shape of groove on the life time of rope
The calculations are carried out with the same condition in items (3-1) and (3-2), except the shape of the grooves change from hard (V) shape with groove angle ( = 40°) to hard semicircular shape with undercut angle (
= 97°). The result of calculations is given in table (5) and figure [1(a), (b)].
| Usage category Usage density | Number of travels /day | Number of working days /week | Number of complete trips/year | Actual total Number of complete trip (Manufacture ) | Approximate time life |
| (1) Very low | 50 | (7) | 16800 | 153846 | ~ (9) years |
| (2) Low | 125 | (6) or (7) | 42000 | ~ (3) years+ (7) months | |
| (3) Medium | 300 | (5) or (7) | 100800 | ~ one year+ (6) months | |
| (4) High | 7500 | (5) or (7) | 252000 | ~ (7) months | |
| (5) Very high | 1500 | (5) or (7) | 504000 | ~ (4) months |
Notes on table (3):
* Actual total number of complete trip after which the rope replaces must be given from the manufacture.
Note (1): The above value is valued for rope with thickness (8) mm type (DRAKA-25DT).[3]
Note (2): Suspension ratio (1:1), single warp.
Note (3): Safely factor of the rope equal (12), (SF = 12).
Note (4): The shape of traction sheave is “hard (V) with ( = 40°).
Note (5): Estimated Number of complete travel/year = (No of travels/day) X (working days/week) X (52).
Note (6): Actual total number of complete trip after which the rope replaces must be given from the manufacture.
Note (7): The approximate life time = (Actual number of complete trips/ Number of complete trips per year)
| Usage category Usage density | Factor of Safety | Actual total Number of trip (manufacture) | Approximate life time | Factor of Safety | Actual total number of trip (manual eture) | Approximate Time life |
| (1) Very low | 8 | 153846 | ~ (9) years | 16 | 269227 | ~ (16) years |
| (2) Low | ~ (3) years (7) months | ~ (6) years (5) months | ||||
| (3) Medium | ~ one year (6) months | ~ (2) year (8) months | ||||
| (4) High | ~ (7) months | ~ one year one month | ||||
| (5) Very high | ~ (4) months | ~ (6) months |
Note of table (4):
All notes under table (3) are the same, except the factor of safety (SF ) takes two values (12) and (16) to evaluate the effect of factor of safety on the life time of the rope.
| Usage category Usage density | Actual number of complete trip (manufacture) | life time of the rope | ||
| (V) shape, = (40)° | Semicircular with undercut ( | (V) shape, | Semicircular with undercut ( | |
| (1) Very low | 269227 | 411754 | ~ (16) years | ~ (24) years (6) months |
| (2) Low | ~ (6) years (5) months | ~ (6) years (10) months | ||
| (3) Medium | ~ (2) year (8) months | ~ (4) years | ||
| (4) High | ~ one year, one month | ~ one year (8) months | ||
| (5) Very high | ~ (6) months | ~ (10) months | ||
Note of table (5):
All notes under table (3) are the same, except the the shape of groove are (V) shape with ( = 40°), and semicircular with undercut (
= 97°).
The factor of safety equal (16).
4- Results and discussion
From the above results it can observed that:
(a) The life time of the rope depends on the usage density type of building (varies from very low …. up to very high), i.e its values varies from approximately (9) years …. down to (4) months respectively.
(b) By increasing the safety factor, the life time increases, as shown in table (4), this increase can be approximately double in usage category (1), (2), (3) corresponding to usage density very low, low and medium respectively. But in the usage density high and very high the difference in the life time of ropes is not significant, so the cost of the rope is the factor of choise for the type of rope.
(c) The effect of shape of the groove in the traction sheave either hard (V) shape with angle ( = 40°) or semicircular with undercut angle (
= 97°), on the life time of the rope (table(5)) is as follow:
(1) In low and very low usage categories the effect can be clearly observed on the life time of rope which approaches approximately to the double when use a groove with semicircular undercut angle as compared with those of (V) shape.
(2) But at usage category very high, the difference between life time of rope is not significant.
(d) Ropes’ manufactures must provide the installer of elevator complete data about the number of bending (corresponding to the number of complete trip) for their productions, either for use in grooves that have (V) shape, or these used in semicircle with undercut.
5- Conclusion
This article give mathematical model for estimation of the approximate time life of the rope, depending on the physical characteristics of the rope, usage category, duty operation of the elevator the installer can use it as guide value for rope’s replacement.
But the inspection which is carried out by competent persons still the basic and necessary method to determine when the rope must be replace.
References:
- 1-BSI (2015) BSEN ISO 25745-2: 2015- Energy Performance of Lifts, Escalators and Moving Walks. Energy Calculations and Classifications for Lifts (London- British Standard Institution).
- 2- Transportation Systems of Buildings CIBSE Guide: 2015.
- 3- Technical Data DRAKA-GUSTAV WOLF (DKAKA-250DT)
Get more of Elevator World. Sign up for our free e-newsletter.


