
A look at why it should be studied.
Why Should We Study Traffic Analysis?
An elevator system consists of vertical roads (the shafts) and vehicles (the cars or cabs) inside a tall building, like the horizontal transportation system of a city. The obvious function of an elevator system is to transport building occupants and visitors to and from different floors safely, comfortably and, of course, timely. The first two objectives are the concern of design, installation and maintenance engineering professionals in the elevator industry. The third objective is what building owners, architects, facility managers and all users (i.e., elevator passengers) pay attention to.
According to Chapter 3 of Strakosch G.R. and Caporale R.S. (2010), The Vertical Transportation Handbook, 4th Edition, John Wiley & Sons, Hoboken, the task of providing vertical transportation (VT) is one of time and motion study if the number of people who require elevator service within a given period of time is known. Such a provision embraces many variables, the most important being human engineering factors and human reactions to multiple elevators. As mentioned in Barney G. and Al-Sharif L. (2016), Elevator Traffic Handbook – Theory and Practice, 2nd Edition, Routledge (2016), there are two main areas of elevator design: engineering design and traffic design. Safe and comfortable design belongs to engineering, while traffic design ensures passengers arrive at their destinations efficiently and on time.
Traffic design basically involves the design of the elevator system so that it can transport the required number of passengers in a specified time under the stipulated performance conditions. Barney and Al-Sharif’s book summarizes the VT problem as the requirement to move a specific number of passengers from their origin floor to their respective destination floors, with the minimum time for passenger waiting and traveling, using the minimum number of lifts, core space and cost, as well as the minimum amount of energy. Furthermore, the aim of elevator traffic engineering is to achieve a compromise between cost and performance by optimizing a group of parameters. This is the core mission of every elevator system and illustrates how important traffic analysis is to it.
Three additional references on traffic analysis are the Chartered Institution of Building Services Engineers (CIBSE) Guide D: 2020 — Transportation Systems in Buildings, London; So A. (2019) The Elevator: From Basics to Calculus (digital), ELEVATOR WORLD; and So A. (2021) The Solutions to the Elevator: From Basics to Calculus (digital), EW. As a matter of fact, the majority of the content of this article is extracted from the last two books written by your author.
Traffic analysis can be applicable to both design and real-time operation. Before an elevator system for a new building is specified or designed, traffic analysis has to be conducted offline so that designers can determine the number of elevators to be installed, floors served by each, contract capacity (CC) in terms of number of passengers of each, rated or full speed (measured in feet per minute or meters per second; 1 m/s ≈ 200 fpm being a good rule of thumb) of each and the types of doors used (side opening or center opening), etc. Such general conceptual design by calculation is recommended by ISO 8100-32: 2019 – Lifts for the Transportation of Persons and Goods Part 32: Planning and Selection of Passenger Lifts To Be Installed in Office, Hotel and Residential Buildings. According to the Standard, ISO 8100-32, there are seven steps to execute the design process, which are in the following sequence:
- a) collection of building data and population;
- b) selection of traffic analysis method;
- c) selection of design criteria;
- d) choice of initial lift (elevator) configuration;
- e) execution of traffic analysis for the chosen configuration;
- f) fine adjustment of the configuration;
- g) documentation of all processes and records.
Regarding the selection of analysis method, for simpler cases, e.g., the building height is less than 18 floors served by less than eight elevators in the group and with one entrance floor only, etc., a calculation method based on uppeak traffic to determine the uppeak handling capacity and interval is considered sufficient. For more complex traffic demands and all cases with destination control systems, computer simulation shall be carried out. In section 5.5 of the Standard, the calculation method is one recommended approach as the starting point of traffic analysis of an initial elevator configuration, together with other approaches such as designers’ experiences and rules of thumb, etc. Certainly, calculation is obviously a more conscientious way to perform such initial design.
After an elevator system is put into real operation, traffic analysis has to be performed in real time or online for the supervisory control system to allocate the best cab to answer each landing call (a call made at the lobby versus a car call made inside the cab). Furthermore, in ISO 25745-1 and –2 on Energy Performance of Lifts, Escalators and Moving Walks, traffic analysis by computer simulation is employed to estimate the annual energy consumption of an elevator based on some standard on-site measurement. What is going to be discussed in this article may be more popularly used in Europe and Asia, but the principle actually works in North America, as well. So, the methodology should, in general, be globally applicable.
Types of Traffic
There are different types of buildings served by elevators, namely commercial, residential, institutional and others like hospitals, courts and transportation terminals. The one that mostly demands a good elevator system may be office buildings, which are usually almost fully occupied during weekdays and vacant during weekends. There are, in general, four major types of traffic in a high-rise office building: uppeak (also called incoming), down-peak (also called outgoing), lunch mixed-peak and random interfloor.
Uppeak traffic is the most important type to be handled by an elevator system when the building is originally vacant in the early morning, and it is quickly filled up in approximately half an hour, say from 8 to 8:30 a.m. on a weekday, etc., to a certain percentage: for example, 80%. During uppeak, occupants usually arrive at the main lobby (called the main terminal, MT), normally at the ground floor, and request elevator service to their upper destination floors. Under this situation, passengers board every elevator cab arriving at the main lobby as full as possible. Then, the cab goes upward and reaches different destination floors based on car calls made by the onboard passengers until the cab is vacant at the highest reversal floor, where it then makes an express trip back to the main lobby. Down-peak traffic occurs in the late afternoon, when occupants leave the building after office hours. The dominant or only traffic flow is downward. Most passengers from different floors get to the same destination, i.e., the MT, and leave the building. Compared with uppeak traffic, down-peak traffic tends to be shorter in the duration, but the arrival rate much higher.
Lunch mixed-peak traffic occurs during the lunch period, when passengers leave their office and get down to the MT to exit the building for lunch, while also entering the building at the MT to get back to their offices after lunch. Very often, there are restaurants at the bottom or top floors of the building, making the traffic more complex. This mixed traffic has simultaneous passenger arrivals and departures of upward and downward traffic with some limited interfloor traffic. In modern buildings, the lunch mixed-peak traffic gradually becomes the most difficult situation to be handled. In buildings occupied by a single tenant, different times for lunch commencement could be assigned between departments to lower passenger demand. In buildings occupied by different tenants, the lunch hours are automatically distributed but more concentrated: for example, some from noon to 1 p.m., and some from 12:30 to 1:30 p.m. Random interfloor traffic occurs anytime within the working hours when passengers travel between different floors, instead of leaving or entering the building. Usually, this type of traffic is not considered serious in office buildings. However, it is a different story when institutional buildings, such as university educational buildings with lecture rooms on different floors, are considered.
This article is on fundamentals; our discussion is still based on the consideration of uppeak traffic.
Parameters Involved in Uppeak Traffic Analysis
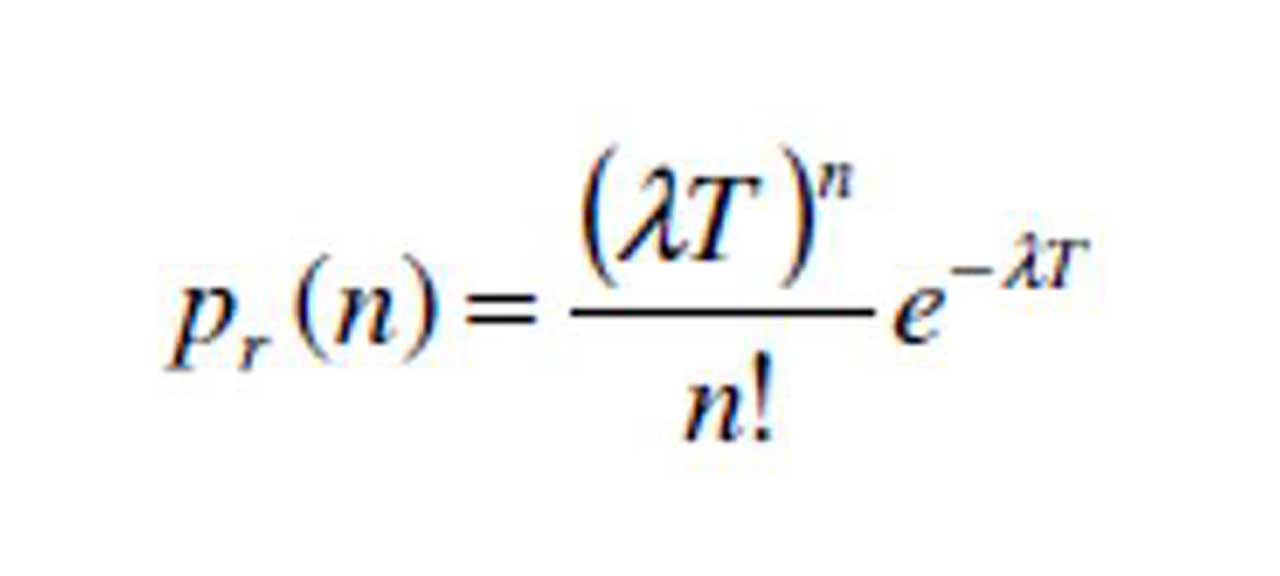
The passenger demand is the most important data to be collected first, which is usually represented by a certain percentage of the total possible population of the building within a subperiod of 5 min under an uppeak condition, e.g., 11% to 15%. Then, the concept of “30-min handling capacity” is adopted. For example, if a figure of 13% is used, within the half-hour uppeak period in the morning, 6 x 13% ≈ 80% of the entire building is being filled up. This is a constant arrival rate assumption. But in the industry, it is generally accepted that passengers enter an elevator system according to the Poisson probability process. The assumption is that the probability, pr(n), of n landing calls (one landing call per passenger) being registered within a time interval, T, for an average rate of arrival, (in number of passengers arriving per second), is given by equation (1).
By using a constant arrival rate assumption, the number of passengers arriving at the main terminal during uppeak, P= INT. Here, INT is called uppeak interval, which is the average time between two consecutive elevator arrivals at the MT to pick up passengers waiting there. If the contract capacity of the elevator cab is equal to or larger than P, there should not be any queue waiting at the MT, in principle.
Other parameters needed include number of floors of the building, N (N does not include the MT, which is assigned 0 F; in North America, the MT is usually assigned 1 F); floor height, df (assumed uniform here); rated speed, v (measured in m/s); single floor flight time, tf(1) (time for the cab to travel one floor, stop to stop, excluding door operation); door opening and closing times, to and tc; passenger transfer time, tp (the average between boarding time and exiting time of a passenger into and out of the cab).
Uppeak RTT, Interval and Handling Capacity
Round trip time (RTT) is the most important concept in traffic analysis, in particular, when referred to an uppeak condition. The whole process is shown in Figure 1 extracted from CIBSE Guide D: 2020. The solid line shows the instantaneous position of an elevator cab, with the y-axis representing its position, in floor number, around the building, and the x-axis representing time. MT represents “0th floor,” the ground lobby. The first upper floor is “1st floor,” and the top floor is “Nth floor.” The practice that N does not include the ground floor is mainly for the convenience to derive the formula, which is a bit different from the normal nomenclature in the U.S. In a more universal RTT analysis that includes different types of traffic in one formula, the discussion of which is beyond the scope here, adopting the ground floor at 1F becomes more convenient.
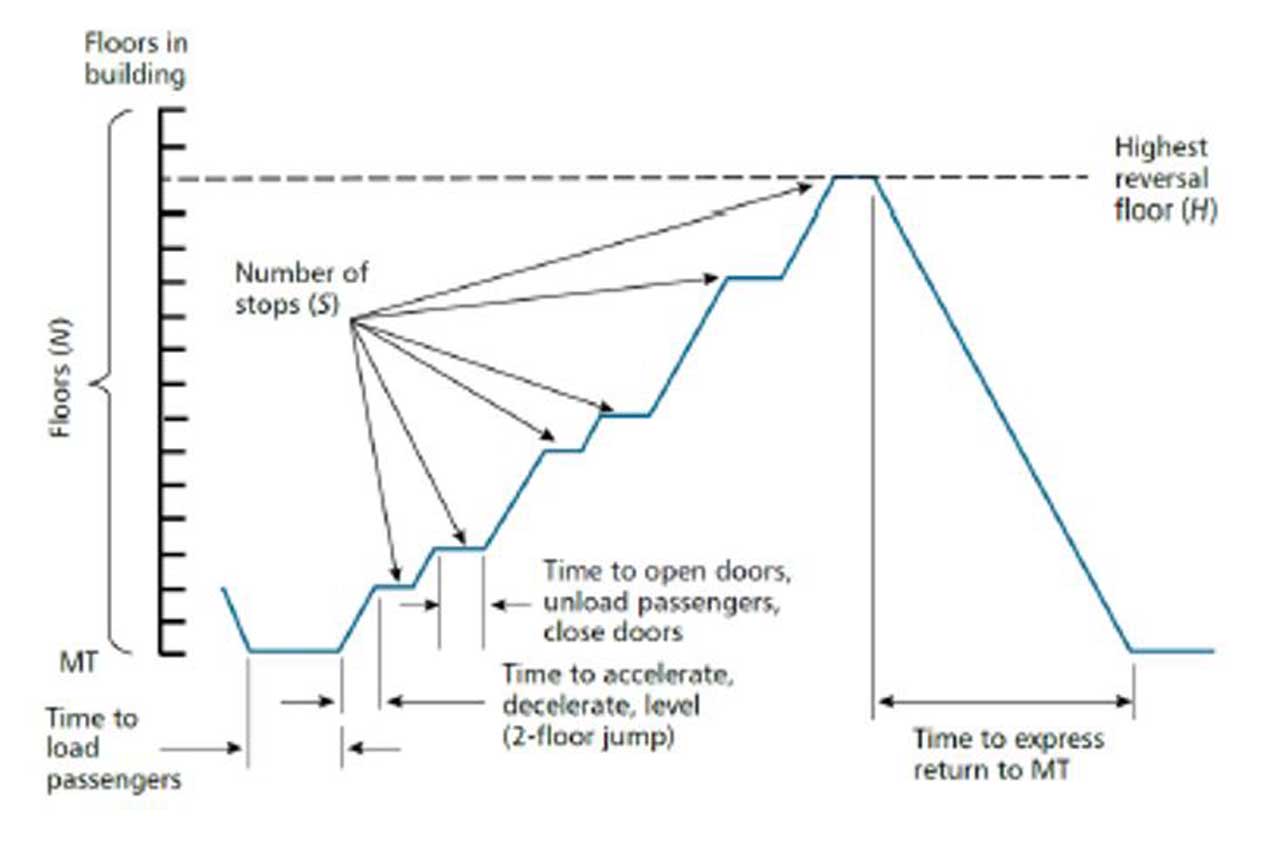
The process starts when an empty cab arrives at the MT. Doors (both landing and car) are opened, and passengers start to load the cab. After the cab is filled up, the car doors are closed. The cab starts to accelerate, decelerate and level to the first stop, which is shown to be the second floor in Figure 1. Some passengers exit the cab, and the cab continues its way to the next stop, until the highest reversal floor, H, is reached. After any stop, it takes time for the doors to be closed, the elevator to accelerate, reach the rated speed or not, decelerate, then level to the next stop and the doors to be opened again. There are S number of stops during such an upward trip (Figure 1). At the Hth (H varies trip by trip but is constant statistically when many trips are considered) floor, the cab becomes vacant, and it takes an express trip down to the MT. During this express trip, the doors are closed; the cab accelerates downward, reaches the rated speed, decelerates when it gets close to and finally level with the MT; and the doors are opened to welcome another group of passengers. This whole process is called a “round trip,” and the total time taken is called round trip time, RTT. It can be estimated by equation (2) by summing up the time duration of all components of a round trip. For example, total time for P (from 0.8CC to 1.0CC during uppeak) passengers to enter the cab=Ptp and total time for them to exit the cab=Ptp. For each stop, doors are opened once spending to seconds and doors are closed once spending tc seconds. It is assumed that half a floor is needed for the cab to accelerate to rated speed and half a floor to decelerate, thus total time for such acceleration or deceleration = tf(1) for each stop. tf(1) has to be provided by the manufacturer but tv (time for the cab to travel one floor under rated speed) can be computed by knowing df and v. There are S upper stops plus the stop at the MT.
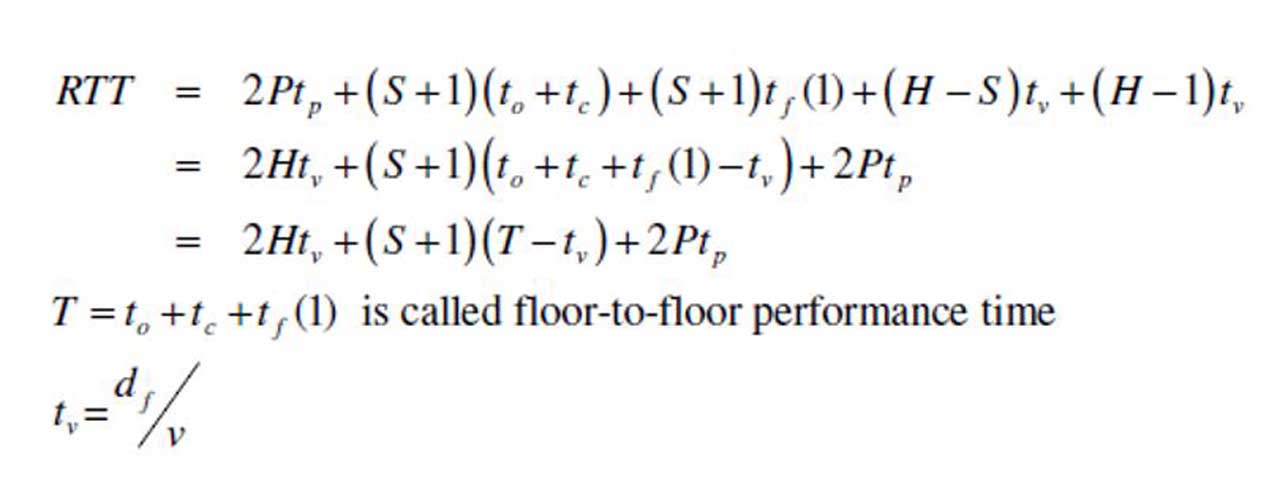
The whole or a portion of the building is served by a group of L number of elevators (called a bank or group). If such L elevators are distributed uniformly around the building, for every RTT/L seconds, a cab arrives at the MT and takes P number of passengers, on average. This time duration is called uppeak interval (UPPINT), given by equation (3). Therefore, in a sub period of 5 min (300 s), the total number of passengers that can be handled by the elevator system, called uppeak handling capacity (UPPHC), can be given by equation (3).
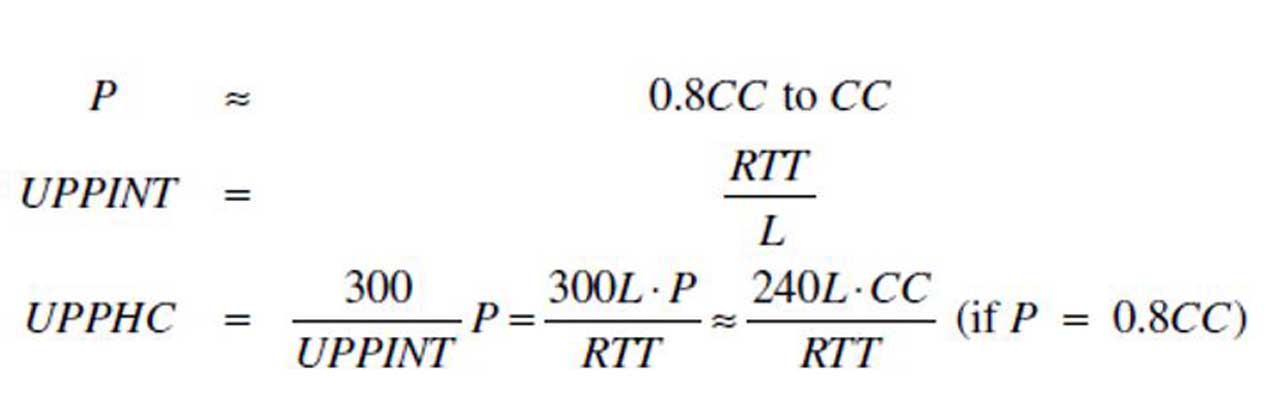
It is desirable that such UPPHC of a tall office building, divided by the total possible population of the building, gives 11-15% during the 5-min subperiod within the 30-min uppeak period. Obviously, a short UPPINT and a high UPPHC are desirable. Going back to equation (3), both goals very much depend on the value of RTT, the smaller the better.
Elevator Kinematics
The assumption that one floor is enough for the cab to accelerate from stationary to rated speed and then decelerate back to stationary is only valid for low-speed elevators, say 1 m/s or below. Figure 2, extracted from Peters R. (1995), “Ideal lift kinematics – complete equations for plotting optimum motion,” Elevator Technology 6, Proc. Elevcon 1995, pp. 175, shows the speed-time curves of three cases. It may take 6 s for the cab to achieve the rated speed of 2.5 m/s, and that is already a two-floor jump.
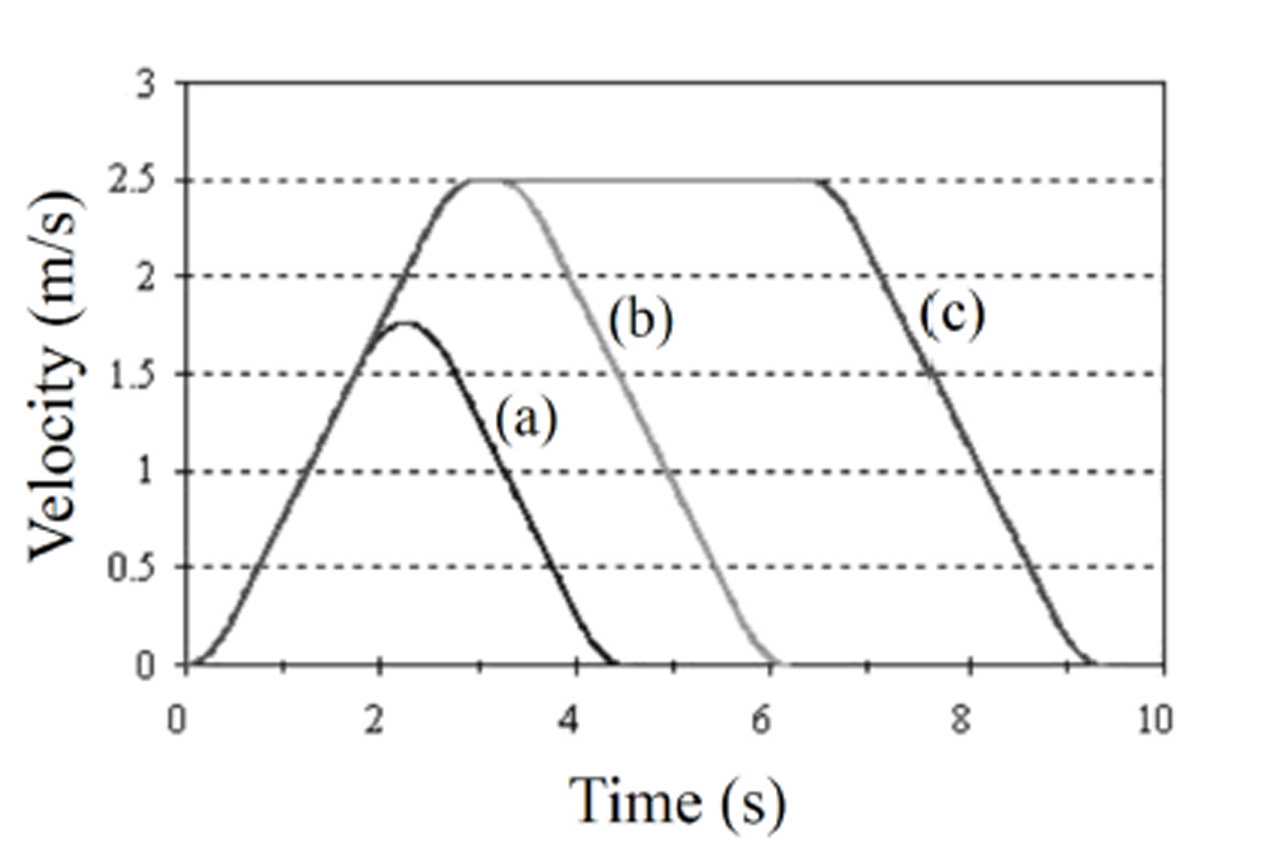
If the rated speed can be attained, equation (4) gives the total time, TD, needed to travel a distance, D (measured in m), by knowing the rated speed (V measured in m/s), the acceleration/deceleration (A for both acceleration and deceleration, measured in m/s2) and rated jerk (J in m/s3).
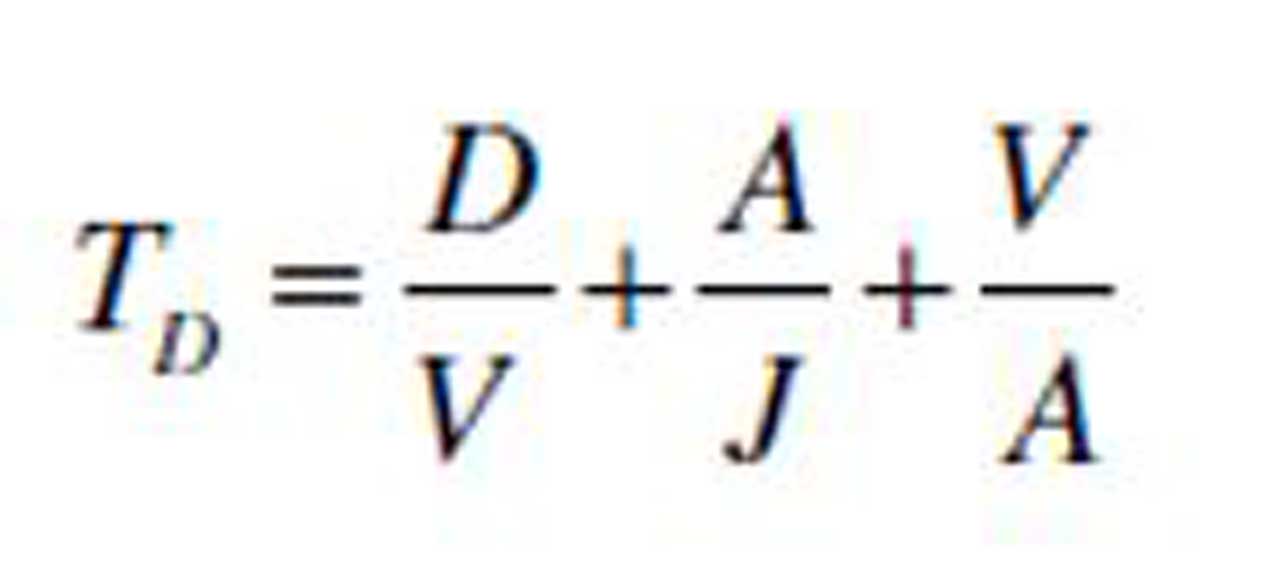
Equation (4) is only valid if rated speed is attained, i.e., cases (b) and (c) in Figure 2. And the criterion is based on equation (5).
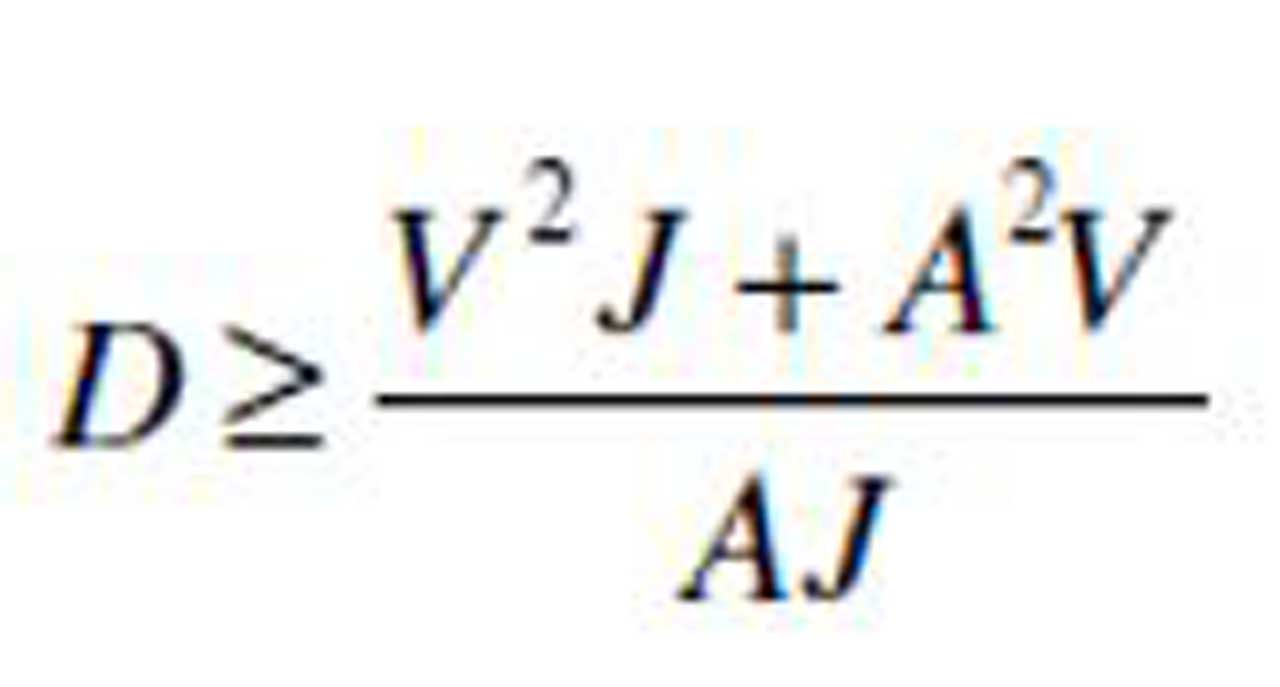
For most of the time, the cab cannot attain rated speed in a single floor jump. So, additional time correction is needed in the RTT equation (2), the discussion of which is beyond the scope of this article.
Highest Reversal Floor (H) and Expected Number of Stops (S)
H and S depend on the distribution of occupants around the building. For example, if the lower floors are densely populated while upper floors sparsely, we expect to see a lower H and a smaller S. On the contrary, H can be high, but S can still be small if only the topmost floors are densely populated. S is largest when the whole building is uniformly distributed.
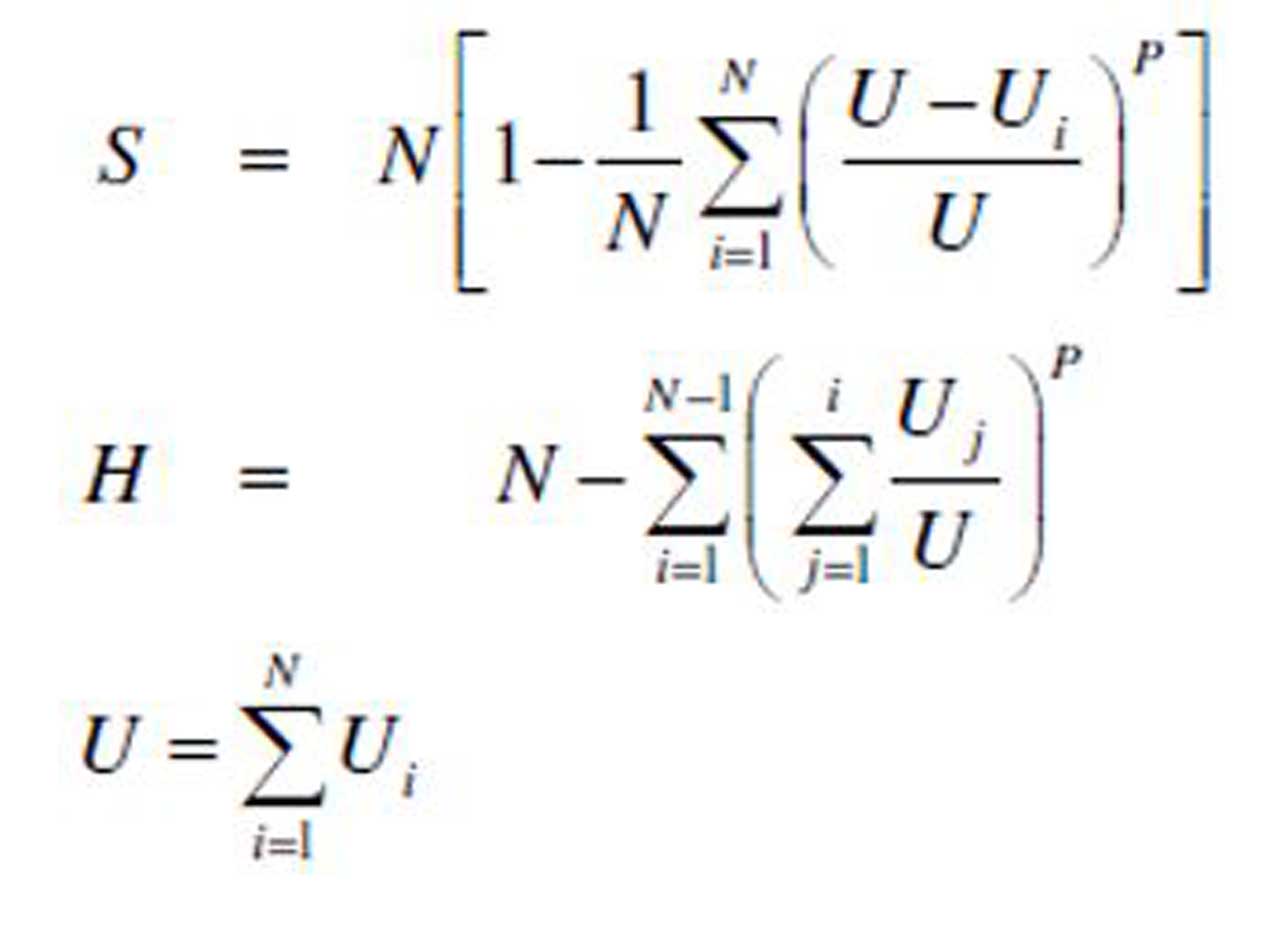
Here, a general population distribution of the N number of floors is given by U1, U2, …, UN-1, UN where Ui is the population of the ith floor, i running from 1 until N. There is no population on the MT because it is where passengers enter the building instead of staying there. The probability of a passenger entering the cab at the MT who does not want to travel to the ith floor is given by 1-Ui/U where U is the population of the whole building. The probability of no passenger inside the cab with P number of passengers who want to travel to the ith floor is given by (1-Ui/U)P. Then, the probability that at least one passenger wants to travel to the ith floor, i.e. a stop at the ith floor, is given by 1-(1-Ui/U)P. S is given by the sum of all these probabilities. For H, the probability that the cab does not travel to any floor higher than the ith floor is first estimated, followed by the probability that the cab does not travel to any floor higher than the (i-1)th floor. The probability that the ith floor is the highest floor for a particular round trip is the difference between the two. H is then obtained by multiplying i to the probability that the ith floor is the highest floor of that trip and adding all these products together. These two parameters can be estimated by the equation set (6).
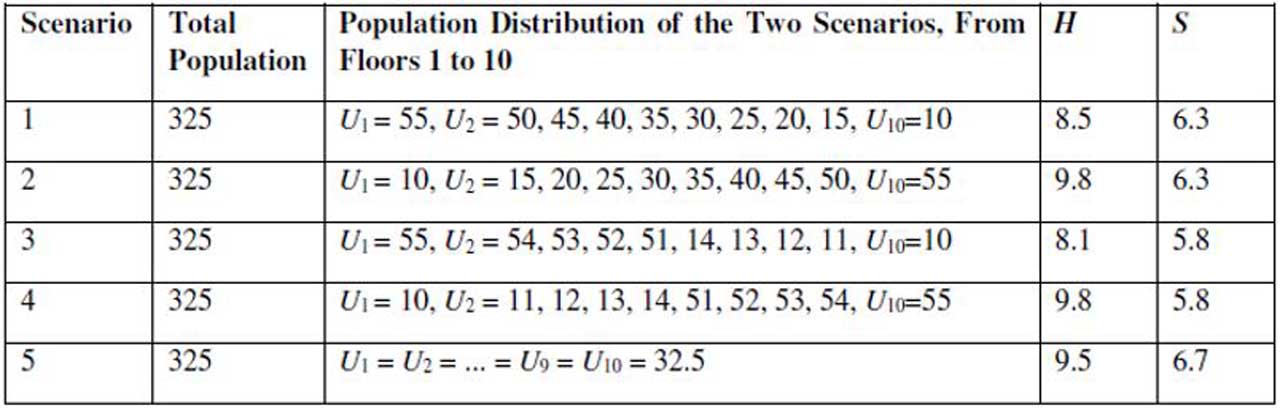
For a special case when the whole building is uniformly populated, U1=U2=…=UN=U/N, H and S can then be estimated accordingly by using equation set (6). In order to demonstrate how H and S are significantly affected by the distribution of the population, Table 1 of a building with N=10 is referred to. CC (=13 in this example, i.e., P=13*0.8=10.4) also affects the values of H and S but less significantly.
The total population of the whole building remains unchanged for all five scenarios. Scenario 3 is extreme in a dense population on lower floors and therefore its H is the lowest. Scenarios 1 and 2 are less extreme in the distribution of population and therefore their S is larger than that of the other two scenarios. Scenario 5 has the largest S because the whole building is uniformly distributed.
Besides the uniformity of population distribution, there could be another non-uniformity, i.e., the floor height. Suppose some floors are taller than others. Then, additional traveling time is to be added to the RTT equation (2). Adjustment of the final value from the RTT equation (2) may be required from time to time due to the existence of dwell times, door pre-opening time and several delay times (start and leveling), etc., the discussion of which is beyond the scope of this article.
A Simple Design Example
A uniformly populated (population on every floor is identical to others) office building with 12 floors above the main terminal has a gross floor area of 2,000 m2 (21,528 ft2) per floor, a uniform interfloor height of 4.0 m (13.1 ft) and an average passenger transfer time of 1.2 s. From experience or by referencing tables, the useable floor area is around 80% of the gross floor area, i.e., a useable floor area of 2,000*0.8=1,600 m2 per floor. Suppose one person occupies 10 m2 of floor area, i.e., 160 occupants per floor, with a total population of 1,920. Based on experience, the daily attendance rate is around 80%, and that means 20% of the occupants may be on leave, working flexible hours or having duty visits. In other words, during the half-hour uppeak period, 1920*0.8 = 1,536 people have to be served by the elevator system.
It is assumed that the arrival rate of each 5-min uppeak sub-period within the half-an-hour uppeak period is 13%. That means within each 5-min sub-period, 1536*0.13≈200 passengers arrive at the main terminal and seek elevator service.
For an office building, an acceptable uppeak interval, UPPINT, is around 30 s. The target now is to design an elevator system that can handle 200 passengers in 5 min with an uppeak interval of 30 s.
It was mentioned before that P is usually assumed to be 80% to 100% of CC. Here, a more conservative assumption of 80% is adopted. Within 5 min, there are 300/30=10 uppeak intervals. Within each uppeak interval, 200/10=20 passengers arrive at the main terminal, and they must be carried by one elevator. So, the CC of the elevator should be at least equal to 20/0.8 = 25. The typical capacity of an elevator in the U.S. is between 2100 lb and 5000 lb. A standard 3500-lb-capacity elevator can accommodate 26 passengers maximum, a good choice for our case. Suppose the rated speed is 350 fpm, i.e., 1.78 m/s, and center-opening 42- x 84-in. doors (door operating time = to + tc = 3.3 s) are used, the following assumptions could be made:
- tf(1) = 6 s;
- all delay times are ignored;
- P=26*0.8≈21;
- tv=df/v=4.0/1.78≈2.3 s;
- T-tv=3.3+6-2.3=7.0 s;
- tp=1.2 s.
By using equation set (6), H can be calculated as 11.8, and S can be calculated as 10.1.
- RTT = 2 * 11.8 * 2.3 + (10.1 + 1)*7.0 + 2 * 21 * 1.2 = 182.38 s.
- If L=6 elevators are installed, UPPINT = RTT/L = 182.38/6=30.4 s. Then, HC=(300*21)/30.4=207.2.
It seems that the handling capacity is adequate while the uppeak interval is a bit marginal. Practically, one more spare elevator is needed first to improve the uppeak interval, second to act as a standby during breakdown of either one and, third, to add some design margin here as quite a lot of additional adjustments in the RTT equation (2) have not been made. If L=7 elevators are installed, UPPINT = RTT/L = 182.38/7 = 26 s. Then, HC=(300*21)/26=242.3. The design seems perfect now.

Get more of Elevator World. Sign up for our free e-newsletter.
![]()


![]()