The question of how to determine the best elevator service has been a topic of debate since the early 1900s. In 1920, an answer was offered.
The question of how to determine the best elevator service for a given building has been a topic of intense debate and investigation since the early 1900s. In May 1920, at the annual meeting of the Elevator Manufacturers’ Association, a young engineer named Howard B. Cook presented a paper titled “Passenger Elevator Service” that offered an answer to this important question. Cook had graduated from the University of Cincinnati in 1912 with a degree in Electrical Engineering. He worked for Allis-Chalmers Co. prior to and throughout his university career, gaining experience in the foundry and machine shop, as well as experience working with commutators and winding and testing transformers. Following graduation, he left Allis-Chalmers and was briefly employed by Brownell Co. of Dayton, Ohio, as an assistant chief engineer. In 1913, he left Brownell and joined Warner Elevator Manufacturing Co. of Cincinnati. Cook’s paper was later published by Warner; thus, it may have been conceived, at least in part, as a promotional piece aimed at architects, engineers and potential clients.
Cook divided his presentation into three parts: a brief introduction, an investigation of two elevator service models (with operating speeds of 400 and 600 fpm) and a conclusion that compared the two models. The paper’s opening sentence indicates his very direct, no-nonsense approach to this topic: “The right way to deter-mine the proper number of elevators to install in a building is to estimate the number of passengers that will enter and leave in an hour and divide this number by the number of passengers that an elevator will carry in a hour.” This statement is followed by a series of assumptions asserted as facts, which were described as de-rived from “observation.” According to Cook, the average number of people that enter a building on a daily basis is determined by the building’s “rentable floor area.” For example, in an office building, the “average for 10 hours is equal to one passenger per hour in each direction for each 200 sq. ft. of rentable floor area.” He also noted that the maximum traffic volume “seldom” exceeded “an average of one passenger per hour in each direction for each 150 sq. ft. of rentable floor area.” The maximum traffic volume occurred early in the morning, at noon and in the evening “when the occupants are leaving” and was generated solely by the building’s occupants – “never” due to visitors.
Based on these assumptions, Cook offers the following initial conclusions: “Having determined the maxi-mum traffic as equal to the average of one passenger per hour in each direction for each 150 sq. ft. of rentable floor area, the next logical step is to determine the carrying capacity of an elevator.” Of course, Cook has not actually “determined” anything in terms of proving that his assumption for the maximum traffic volume is correct. Nonetheless, he proceeds with the “next logical step,” the first part of which concerns calculating the round-trip time. This calculation involves the articulation of a series of variables, many of which were as-signed fixed values by Cook. These variables include:
- Elevator speed (400 fpm)
- Rate of acceleration and retardation (4 fps per s.)
- Number of floors above the first
- Distance between floors (12 ft.)
- Number of stops (assumed to be equal to the number of passengers unless the number of passengers per trip exceeds the number of floors above the first)
- Time required for a passenger to enter or exit the car (1 s. at the first floor and 2 s. for upper floors for one passenger, adding 1 s. “for each additional passenger if more than one enters or leaves at the same time;” thus, this variable is assigned a value of 3 s.)
- Time required to open and close the car/shaft doors (for the upper floors, assume 1.5 s. to open and 1.5 s. to close the doors – 3 s. total; however, at the first floor, “an additional amount of time must be allowed. . . to stop and start and to equalize the schedule between the several elevators on account of the fluctuation in the traffic and other variable influences.” This additional time is assumed to be 7 s.; thus, the total round-trip door opening/closing time equals 3 + 7, or 10 s.).
- The number of passengers per trip
- The definitions of these variables serve as a reminder that in 1920, elevators required operators, most car and shaft doors were manually operated, and elevator traffic in large buildings was directed by an individual (known as a “starter”).
At this point, Cook introduces the first of several mathematical formulas he uses to determine the best elevator service in a given building. The first is V2 = 2AS, where V equals final velocity in fps, A equals the rate of acceleration in fps per s., and S equals the distance required to accelerate to or stop from full speed. This formula is a simplified version of V2 = U2 + 2AS. (U equals initial velocity.) Because Cook assumes that the initial velocity is zero, he simply omits U from his formula. Using the above variables and their assumed values, V2 = 2AS becomes 6.662 = 2(4S); therefore, S = 5.55 ft. Cook assumes that the average speed during the period of acceleration and deceleration is equal to half the operating speed, or 3.33 fps; thus, the time required to travel 5.55 ft. is 1.67 s. He also notes that the time required to travel at full speed between floors is equal to 1.8 s. (12 ft./6.66 fps). With this information, he is able to derive a formula to determine the single trip time: 1.8F (running time at full speed multiplied by the number of floors above the first) + 1.67P (time required for stopping and starting multiplied by number of passengers per trip) + 3P (time required for each passenger to enter or exit car multiplied by number of passengers per trip) + 3P (time required to open and close doors multi-plied by number of passengers per trip). This formula, 1.8F + 1.67P + 3P + 3P, is more simply expressed as 1.8F+ 7.67P. To calculate the round-trip time (R), he doubles the single-trip time and adds 10 s. to account for the elevator starting and/or stopping at the first floor. The resulting formula is R = 2(1.8F + 7.67P) + 10, which is simplified to R = 3.6F + 15.34P + 10. Cook labels this formula Equation 1.
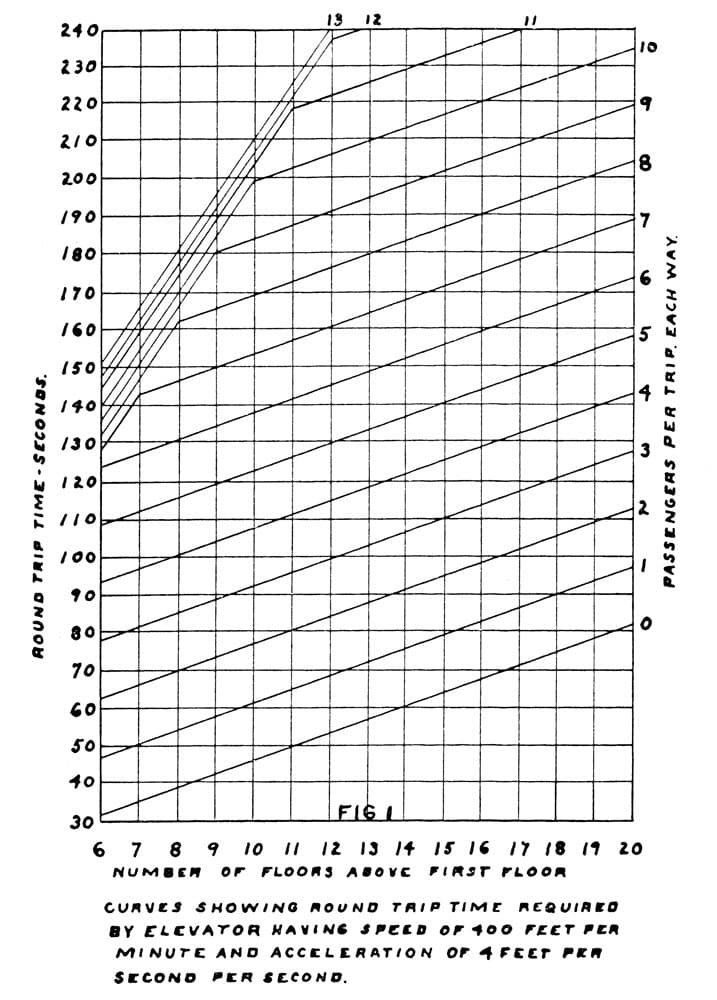
Following this derivation, Cook notes that Equation 1 will not, in fact, yield accurate results if the number of passengers per trip exceeds the number of floors above the first. To adjust for this, he adds 4 s. to the round-trip time for each additional passenger over the limit. He does not, however, provide an explanation of how he deter-mined that 4 s. was an appropriate adjustment, nor does he explain how he derived the formula to determine the round-trip time for this situation, which he labels Equation 2: R = 3.6F + 15.34F + 4(P – F) + 10, which is simplified to R = 14.94F + 4P + 10. Cook apparently assumed a base-line capacity where the number of passengers equaled the number of floors (P = F); thus, he substituted F for P in Equation 1, and he expressed the need to account for additional passengers and their associated additional time as 4(P – F). Equations 1 and 2 are used to generate a chart (Figure 1) that indicates the round-trip time (in seconds.) for various numbers of passengers (one to 10) and floors (six to 20).
The next step in this process is to determine the number of passengers carried per hour, which Cook states will “obviously be equal to the number of round trips per hour multiplied by the number of passengers per trip.” The formula he provides to determine the number of passengers carried per hour, T (with the time expressed in terms of seconds), is:

Equation 3 is used to generate two new equations that reflect the different values of P as expressed in Equations 1 and 2. For example, P derived from Equation 1 may be
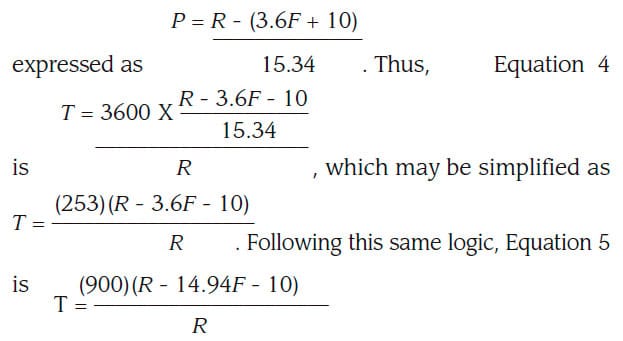
It is important to note that the publication of Cook’s paper contained apparent errors in the printing of these two formulas, and that Equations 4 and 5 as written to the left represent my efforts to correctly express Cook’s intentions. Cook used these equations to generate a second chart (Figure 2) that indicated “the number of passengers carried each way per hour by one elevator.”
At this point, Cook notes that there are other factors that must be accounted for in determining elevator service:
“Good elevator service demands that the round-trip time shall not be excessively long and there are rather well defined limits which should not be exceeded. The time spent by a passenger waiting for a car usually causes as much if not more uneasiness than the same time spent in reaching the top floor.”
Cook then provides a somewhat confusing statement concerning how to determine the proper service interval:
“The proper measure of a service is the length of time from the departure of one elevator until the next elevator reaches the top floor. Observation of existing installations which are giving satisfactory service shows that this time should not exceed 2 min.”
From this statement, he assumes a maximum round-trip time of 2 min. and derives his next formula, Equation 6, which is expressed as follows (R = round-trip time in seconds, and E = the number of elevators): XXXXX Cook then transposed R and expressed the final version of the equation as XXXXXX Equation 6 is also used to generate a chart (Figure 3) that features “curves showing round trip time and interval between elevators to make interval plus time to top floor equal to 120 seconds.” This chart would, presumably, give the starter an indication of the required interval to dispatch elevators from the first floor to meet the 2-min. round-trip time interval.
Cook next substituted the value of R from Equation 6 into Equations 4 and 5, which gave him:

and

These were used to generate data for a chart (Figure 4) that expressed “the number of passengers carried each way per hour by each elevator having a speed of 400 fpm and acceleration of 4 fps per second to maintain a 2-min. service interval.” This led him to the last step in this process, which was to combine his results to produce a chart (Figure 5) that depicted the “proper number of elevators to install in a building.” The “curves” shown in Figure 5 were calculated by “multiplying the number of elevators by the capacity of each and this result was multiplied by 150 to give the total area.” The phrase “total area” refers to the total rental area of the building for which elevator service is being determined.
This carries us to the halfway point of Cook’s presentation. The majority of the second half of his paper is devoted to examining the service provided by elevators operating at 600 fpm and a comparison between this service and a 400-fpm elevator. Additional information included in the second half of his paper once again serves as a reminder that elevator service in the early 20th century depended on more than efficient machines. For ex-ample, in determining the proper car size, 3 sq. ft. must be allotted to account for the elevator operator.
The results predicted in Cook’s various charts were also dependent on the operator’s ability to “make good floor stops without loss of time.” The latter statement was necessary because very few elevators operating in 1920 featured automatic leveling systems. The “human factors” that Cook was forced to account for in his equations – the behavior of starters, elevator operators and passengers – reveal the complexities he faced in at-tempting to provide a rational basis for determining good elevator service. Of course, the behavior of people and how they interact with elevators remains one of the most interesting (if occasionally baffling) factors of elevator design.
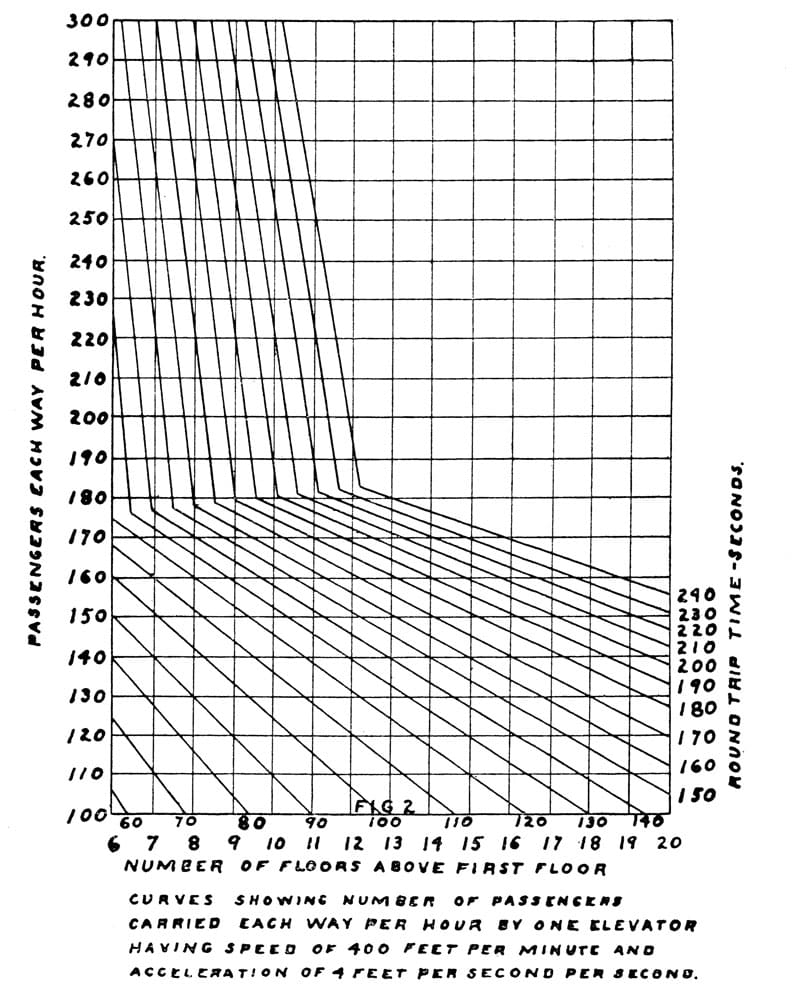
Figure 2 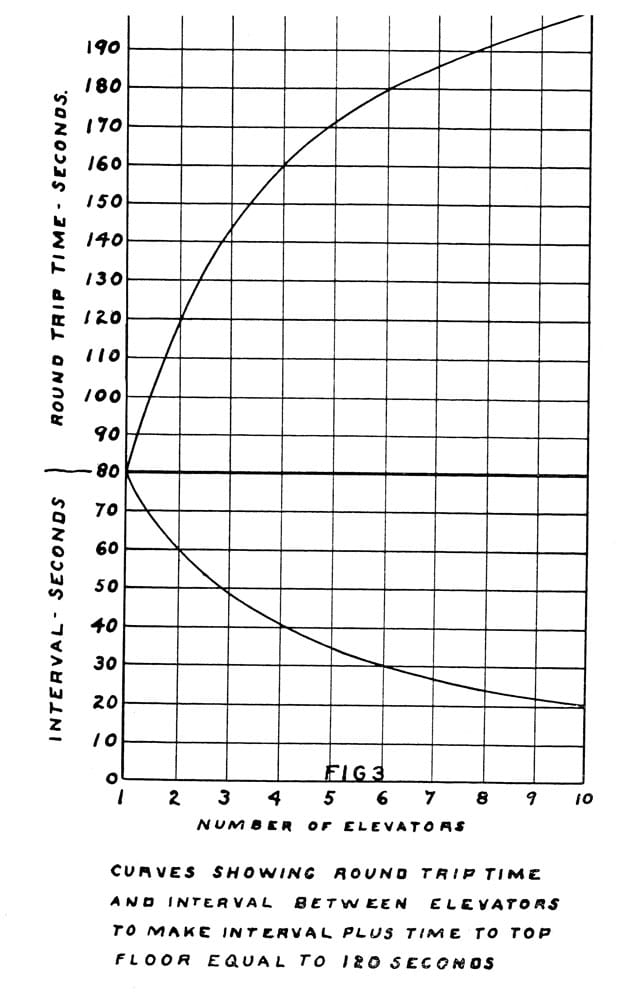
Figure 3 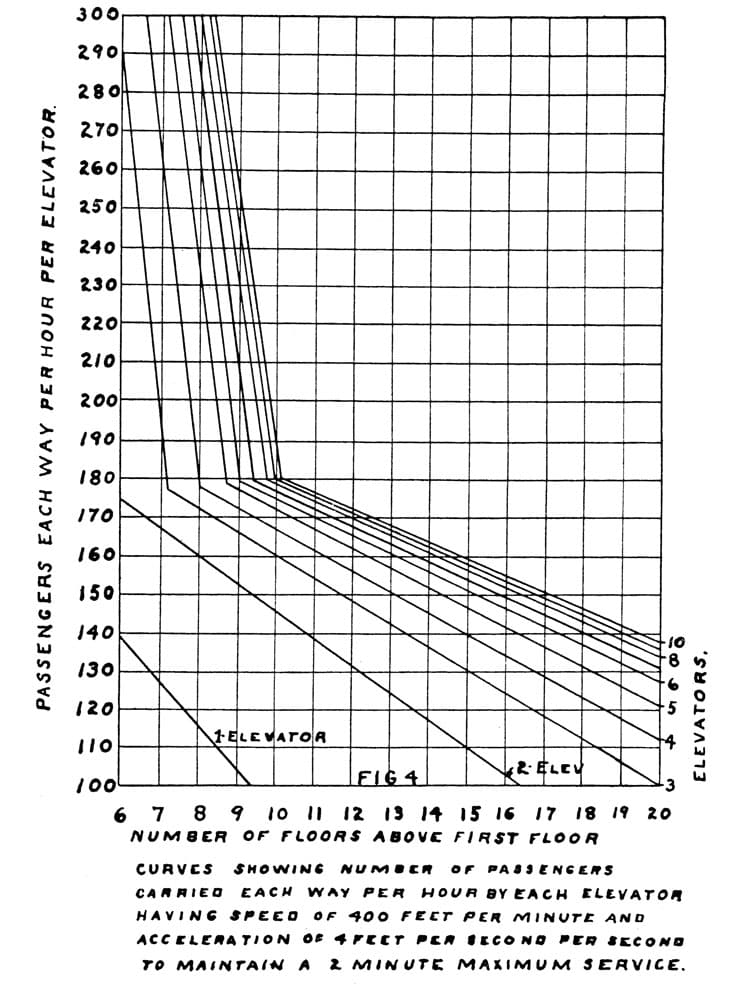
Figure 4 
Figure 5
Get more of Elevator World. Sign up for our free e-newsletter.
