Results of a Field Trial Aiming at Demonstrating the Permanent Detection of Elevator Wear Using Intelligent Sensors
Oct 1, 2016
New concepts and strategies in data acquisition and analysis for elevators
This paper was presented at  Madrid 2016, the International Congress on Vertical Transportation Technologies, and first published in IAEE book Elevator Technology 21, edited by A. Lustig. It is a reprint with permission from the International Association of Elevator Engineers
  (website: www.elevcon.com).
Condition-monitoring systems for elevators going beyond a mere display of stored faults or counter readings are hard to find on the lift market. Yet, only a few sensors are needed for the monitoring of significant components of a lift system to ensure wear is detected at an early stage and appropriate servicing recommendations are automatically generated. As such, predictive maintenance of elevators, which saves a lot of resources and time, is possible. Nevertheless, it warrants a high availability of the lift system.
Within the context of a field trial, several lift systems in Germany have been equipped with vibration and/or acceleration sensors, load sensors and a special electronic assessment system that evaluates every single elevator ride using intelligent algorithms permitting the wear of individual component groups to be detected.
Introduction
The concept of a condition-monitoring system for lifts was introduced in 2012 at Elevcon USA by one of your authors. It allowed the implementation of a predictive-maintenance strategy with fewer sensors. In contrast with other condition-monitoring systems already used in the industry, not one sensor will be used to monitor the components used in the present system for lifts. This will be managed mainly by vibration and acceleration sensors. This reduction of sensors is possible because of an analysis of the data directly at the lift installation. The knowhow from many years regarding acceleration and load sensors directly influences the evaluation algorithms. For example, this makes it possible that conclusions about the state of the drive or gearbox can be drawn from vibration data measured on the car. The 2012 concept has since entered its maturity phase (in late 2015) as a standalone system named WEARwatcher. It provides continuous monitoring, which measures and monitors constantly, in real time, the physical parameters of the elevator. Thereby, the system is able to detect long-term trends, as well as abrupt or transient state changes. Downstream state comparisons and diagnostic algorithms can revert to a large amount of data and generate maintenance recommendations. In this article, the structure and operation of this system and the first findings from the continuous use of it will be displayed.
Predictive Maintenance
The use of this condition-monitoring system allows carrying out predictive maintenance. The system can detect problems of components before influencing the system status. It contributes an improvement of reliability based on efficient predictions of defects (and resulting avoidance). It minimizes the downtime based on an integrated planning of repairs, maximizes the life of the components by avoiding life-shortening conditions and contributes to cost savings by an almost complete utilization of the wear reserve of the components.
Monitoring System
Data Acquisition
WEARwatcher is a maintenance-free standalone device. It basically consists of two components: the motherboard, called the Cape, and the Beaglebone computing unit.
Cape and Acceleration Sensor
The Cape takes the measurement data recording and communication via various interfaces. With the integrated three-axis acceleration sensor, acceleration data in the X, Y and Z directions is taken and pre-evaluated. “Pre-evaluated” means that the acceleration data is filtered and cut down to a sample rate of 200 Hz, marked with a unique timestamp with some status information attached (e.g., the state of the input/output ports with external sensors connected).
Beaglebone
The real heart of the WEARwatcher, a Beaglebone single-board computer, processes the acceleration data, stores it and returns it to the Cape for communication to the outside world. The Beaglebone single-board computer is a very powerful Linux-based computer with a variety of interfaces, which makes it possible to evaluate the driving conditions of the elevator in real time. The system is battery buffered and processes a controlled shutdown in the event of a power failure to prevent loss of data.
Load Measurement
The current weight of the elevator car is an important factor, which has to be recorded with every trip. It has an essential influence on the vibration parameters taken by the WEARwatcher monitoring device.
To record the current weight of the elevator, an external load measurement has to be connected to the monitoring device. Ideally, this connection is realized via the integrated CANopen interface, either directly as a one-to-one connection or on the CANopen bus of the lift system.
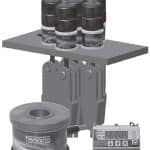
A possible load-measurement device is the RC series by Henning GmbH & Co. KG, called “Donut,” with the appropriate evaluation unit. The load sensors are installed directly at the hitch point and are able to measure absolute weights at each rope or belt.
Data Handling
Software Concept
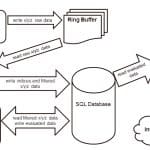
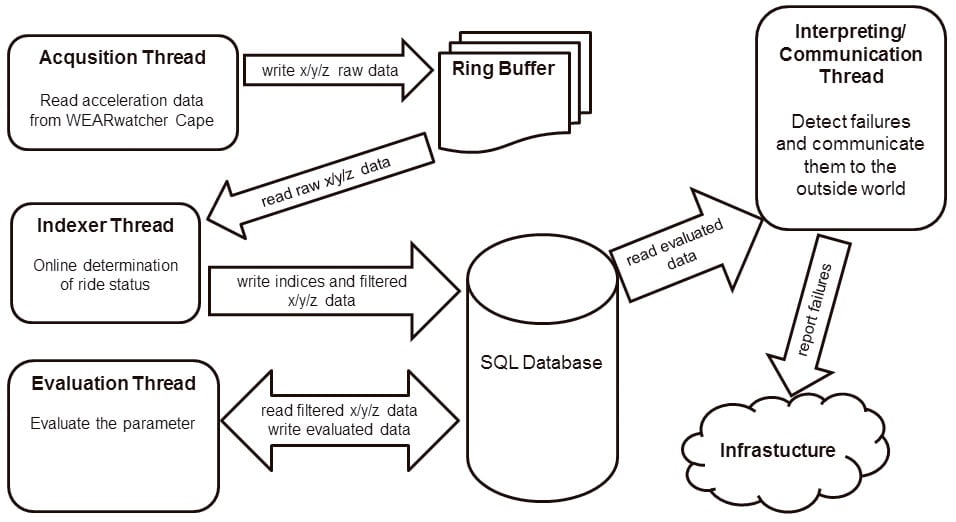
The software on the Beaglebone is an application in which several processes run simultaneously, a “multi-threading” application (Figure 2).
The process of the measurement data acquisition reads the acceleration data from the Cape and stores it temporarily in a ring buffer. The indices of driving states and the acceleration data are stored in a Structured Query Language (SQL) database. Up to here, everything takes place in real time.
The third process is the most complex and computationally intensive. It reads the ride indices and the acceleration data back out of the SQL database and evaluates them. Among other things in this process, evaluations based on ISO 18738 (ride quality) and further analyses, such as frequency analyses, are performed. The results of these evaluations flow back into the database.
The fourth process analyzes the evaluations statistically and detects abnormalities and defects. Those are then transmitted to the outside world (e.g., to a control center or into cloud storage).
Data Reduction
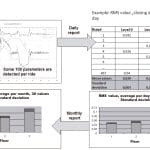
From each ride, more than 100 characteristic values were collected, which, after a few weeks and several hundred rides per day, culminated in a huge amount of data. Therefore, statistical methods were used to reduce the amount of data, these methods being selected to allow not only trend developments, but also sporadic events to be detected in the reduced data volume. In addition to this, several dimensions of data were collected to be able to reflect relationships, for example, between load conditions and vibration values.
Data Visualization
Interfaces
Different interfaces are available at the WEARwatcher monitoring device. The communication via these interfaces is possible with a telegram standard, disclosed to the customer. It offers the possibility to configure the monitoring device, as well as to read measurement data and alarm messages with any controller unit or infrastructure connected to it. These interfaces are, in detail, an RS232 or RS485, an Ethernet connection, and a CANopen interface according to the CAN in Automation lift standard.
Cloud Infrastructure
One possibility of data storage is the use of a cloud server infrastructure. The data retrieved from the WEARwatcher monitoring device are cyclically transmitted via a mobile Global System for Mobile Communications connection and the Internet to a cloud server.
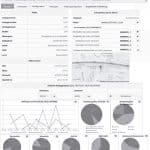
This cloud server is a central, Internet-accessible data server for managing and linking various monitoring devices. The cloud server is linked to a web server that provides a web-based portal for visualization and configuration of lifts. Each user can access this portal via a web-enabled device by the use of a web browser of its choice, regardless if it is accessed by a PC, laptop, tablet or smartphone.
This cloud server can be used in two different ways. First, just as data storage of the data described in the heading “Data Reduction” above: this data can be visualized with different graph views and exported in various formats. Second, as a complete lift maintenance management system, including the functionality from above with the following additions:
- Reading and handling alarm messages and priority
- Sending out messages via short message service or e-mail, according to the collected alarms
- Statistics about alarm messages
- Statistics about the availability of a single lift
- Statistics over the lifecycle of components
Data Evaluation
Evaluation Strategy
As the system determines more than 100 parameters per elevator ride, divided in ride segments and load classes, there will be, for example, in the case of an elevator with 10 stops, more than 8,000 data points per day, which are evaluated over a period of several months in order to detect the wear on the components. With this amount of data, it is obvious that a conventional assessment beyond the limit values is not productive, as there are no references for the limit values, and a human user would have to adjust more than 8,000 limit values. Furthermore, these limit values would have to be individually adjusted for each elevator system, as even structurally identical systems deliver different parameters, depending on the quality of the installation.
This system, therefore, uses a different assessment strategy in which data is subjected to a “trend analysis.” In the process, algorithms do not check against absolute limit values, but examine the curve of each parameter for abnormalities.
This is done with methods of classical curve discussion, which are supplemented by statistic and stochastic functions.
These analyses already occur in the WearWatcher system (i.e., in the elevator system itself). The resulting maintenance recommendations and alarms are subsequently sent to the outside world via the interfaces of the system. However, at the same time, the analyzed parameters are also available for upstream systems, where they can be visualized and processed, if necessary.
Component Allocation
With the analysis of the acceleration data in real time, it is possible for the system to allocate the recorded parameters directly to a drive situation of the elevator. In connection with elementary information regarding the elevator, such as the rope suspension, sheave diameter, type of track, etc., it is possible to allocate signal peculiarities to component groups with the information — in individual cases, even the allocation to an individual component.
The system divides into component groups, cabin door, shaft door, drive system and, if applicable, transmission, ropes and tracks.
Report Classification
A classification of the recognized problem is conducted as soon as the analysis algorithms have detected an abnormality in the signal path and the component allocation has occurred. In the process, the algorithms, based on a knowledge database, determine the probable cause of the defect and allocate a priority and an error code to the report, which can be used in the upstream systems to chronologically schedule the deployment of a service technician and provide the necessary spare parts.
Results of the Field Trial
The results of the field trial are based on measurements on cable lifts. Hydraulic lifts are planned to be tested in one of the next steps. The trial was designed as a combination of observing and documenting saliences and failures of the lift system by the maintenance staff and a comparison to the recorded data.
Basically, the intermittent result of the field trial is very promising. Most of the failures reported and documented by the maintenance staff could be found as a special characteristic in the recorded data. Vice versa, alarms raised by the monitoring device could be confirmed by the maintenance staff on site.
The number of false alarms could be eliminated step by step by adjusting the monitoring and evaluation parameters. A more detailed classifying of alarms and development of new alarm rules contribute to a reduction, as well.
There is still a lot of potential of a much more detailed evaluation of components by refining the existing algorithms and developing new ones. The field test will continue and be extended to other lift systems to get even more experience to more precisely predict the necessary maintenance.
Example
The example below is surely not applicable for modern, gearless elevators, as it refers to a worm drive. Yet, it still clearly indicates the possibilities of the system.
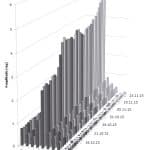
One of the most powerful tools for predictive maintenance is frequency analysis, which is applied during the constant ride of the elevator, as well as in the door movements as one of the analysis functions for the parameter generation. Over the course of the necessary data compression, the resolution of the frequencies is reduced during the transfer to upstream systems, resulting in a visualization of the frequency analysis of all rides during a period in 10-Hz frequency blocks.
Figure 5 shows that most amplitudes of the examined frequencies throughout the recorded period exhibit only relatively minor fluctuations. As these evaluations occur only during the ride section of the constant ride (i.e., at nominal speed), and as, furthermore, all results of a day are averaged, it is expected. However, one frequency block stands out — namely, the frequencies between 41 and 50. For this block, the amplitudes continue to climb in the illustrated period and were detected and reported by the algorithms for wear detection as wear and tear on October 24.
The system is capable of specifying the cause in greater detail. As sheave diameter, and information regarding the transmission and rope/suspension conditions are available in the system as a default setting, and as the speed during the constant ride is measured by the acceleration sensor, the affected component can be precisely isolated with a great degree of accuracy. In this case, it concerns a worm gear with a two-start worm. Per revolution (the revolution can be calculated by the system via the sheave diameter and cabin speed — in this case, 22.8 Hz), this two-start worm generates precisely two “hits” in the transmission if the tolerances between worm and gear wheel no longer fit. The calculated frequency for this fault is, therefore, 45.6 Hz and, thus, appears in the frequency block of 41 to 50 Hz.
Summary
The omnipresent cost pressure in the elevator market and the, in part, massive cost reductions for elevator components effected during the past years have to be caught with suitable countermeasures. Here, predictive maintenance is the key for the future of elevator maintenance in order to efficiently ensure the safety and function of elevators. Contrary to many other machines, elevators are not built reproducible, nor are they employed under controlled environmental conditions. Thus, the classic condition monitoring, as is the case for many other industrial applications, is not applicable in case of elevators. Instead, new concepts and strategies are required in data acquisition and analysis, as they have been implemented in the system upon which this article is based.
- Figure 1: RC load-measurement device “Donut”
- Figure 2: Software concept
- Figure 3: Data reduction
- Figure 4: WEARwatcher Web Portal
- Figure 5: Frequency Analysis Constant Travel
Reference
[1] T. Ebeling. Optimizing Maintenance and Repair – Cost Reduction by Adopting Intelligent Lift System Sensors,” Elevator Technology 19, A. Lustig (Ed.), p. 258-263 (2012).
Get more of Elevator World. Sign up for our free e-newsletter.
