Sensitivity Analysis of Lift Car Installation Design Variables to Guide Shoes Wear
Aug 1, 2011
A numerical sensitivity analysis of how several design variables of a lift-car installation determine the wear of guide shoes is presented.
F. J. Martínez1, R. Monge1, M. A. Martínez2, J. A. Roig3, A. Gómez1 and M. A. Jiménez1
1Instituto Tecnológico de Aragón, Research, Development and Technological Services Area, Zaragoza, Spain
2University of Zaragoza, Spain
3MP Lifts, Spain
This paper was presented at  Lucerne 2010, the International Congress on Vertical Transportation Technologies and first published in IAEE book Elevator Technology 18, edited by A. Lustig. It is a reprint with permission from the International Association of Elevator Engineers
  (website: www.elevcon.com). This paper is an exact reprint and has not been edited by ELEVATOR WORLD.
Key Words: Guide shoes, wear, finite ele-ment simulation, TPU, lift car guides
Abstract
A numerical sensitivity analysis of how several design variables of a lift car installation determine the wear of guide shoes is presented. Analysis is based on finite element simulations in combination with a user- developed model for polymer wear. The simulation of the wear process in the guide shoes follows a numerical-experimental methodology based on initial wear characterization by means of reciprocating tests in tribometer at lab scale; from lab tests results it is possible to derive a wear model for the guide shoes material, which is later implemented in a commercial finite element code to carry out final wear predictions considering real installation parameters.
1.Introduction
Tribology plays a remarkable role in the interaction between the system parts in components of mechanical components that includes parts made of polymers or elastomers, as can be the case of elevator industry. Nevertheless, in general, tribology is usually applied in a very specific sense to a particular contact pair, being specifically applied from an experimental point of view by means of a work based on experience and on a “trail-error” method, instead of developing a micro and macro knowledge of the tribological properties of the system. Besides, there is no a general knowledge in key matters such as lubrication, friction or wear. In this point, the investigation about the tribological properties of the materials involved in the contact pair as well as the development of modelling tools to be applied to the industrial component is really important. This investigation can be used in different stages of the component development for a further application under premises of higher efficiency, higher security, lower cost and lower environmental impact.
The work proposed in this paper takes as starting point the development of a full methodology for characterization and numerical modelling, using finite element simulation, of wear in thermoplastic materials on metallic counter faces working under sliding contact conditions. The methodology can be divided in three principal activities: a), development of a robust methodology for characterizing the wear process of the polyurethane by means of tribotests; b), selection of a suitable wear model from the result that are attained in the tribotests and fitting of model parameters, which is sup-ported by the parallel analysis of the failure mechanisms that are present in the contact between both parts and of the analogy between the wear process and the fatigue grow mate-rial; and c), the numerical implementation of the wear model in a finite element code, with special focus on how to accelerate simulations with-out influencing significantly results precision. Once this methodology is completely developed, it can be applied to the design stage of the component, showing an example of application by means of a numerical sensitivity analysis of how several design variables of a lift car installation determine the wear of guide shoes. Finally, the design, development and starting up of a new tribometer, maintaining the same reciprocating configuration, of longer stroke than that one used to characterize the wear model is also presented.
2. General Description of The Methodology
2.1 Characterization of the wear model
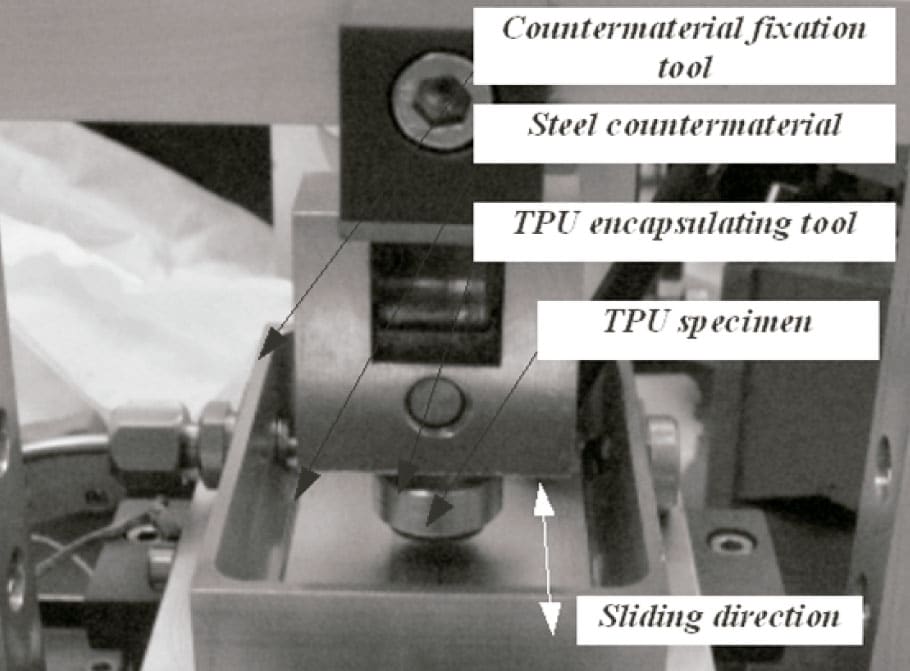
Regarding the characterization of the wear process, tribotests are planned and developed in a commercial tribometer (model Plint TE 77), machining the specimens from the contact pair of the real application, guide shoe insert and lift guide, in order to firstly analyze which are the most influential variables in the wear process. Reciprocating configuration in tribometer is chosen to maintain the same surface structure in the contact pair as in real application (see Figure 1). Along these tests, many variable dependencies have been analyzed, such as load, travelled distance, test frequency, influence of the contact temperature in the wear process, profilometry variation and generated wear debris. To control the influence of all of these variables, a robust procedure for wear testing characterization must be carried out, including, addition-ally, steps of cleaning and maintaining of the specimens, previous preconditioning steps in load and frequency, blowing over the counterface track to eliminate the polymer debris and activation of thermal resistance to manage the homogenization of the test temperature. Along the wear tests, evolution of load, temperature, and friction coefficient curves, as well as the specimen weight loss are controlled. Details of the developed experimental procedure are published in Martínez et al. (2010 (a)). As example of repeatability of results attained in the procedure, Table 1 shows those obtained under one of the conditions considered (75 N of load and 500 m of travelled distance).
2.2 Wear model development
With regard to the wear model development, Archard’s law (Archard, 1953; Greenwood and Williamson, 1966; Sarkar, 1980; Molinari et al., 2001; Liu and Li, 2001) is taken as starting point to fit the wear tribotest results. This model relates the wear in terms of volume loss linearly to the traveled distance and the applied load by means of a constant named specific wear rate. Despite there are authors in literature that have remarked the limitations of this model to characterize wear in polymers, it is still broadly used by other authors, being taken as reference in this work because of the simplicity of characterizing this model from wear tribotest data.
The fitting of the wear tribotests gives an independent relationship between the specific wear rate and the distance but a non-linear dependency between the specific wear rate and the applied load, which contradicts that stated by the Archard’s model. In order to deeply study this relationship and the physical parameter that governs the wear process, a numerical-experimental analysis located at the contact pair is developed. This analysis consists mainly of a study of the worn polymer surface by means of electronic microscopy (SEM) inspections and of an analysis by means of finite element simulations of the wear tribotests located at the contact pair, in order to obtain the stress distribution and evolution with regard to the applied load. From worn surface inspections, as it is shown in Figure 2 and Figure 3, phenomena like wave formation and delamination are observed (Bartenevev and Lavrentev, 1981; Johnson, 1995; Suh et al., 1998; Da Silva et al., 2007), while from finite element analysis (see Figure 4 and Figure 5), maximum shear stresses are located at the subsuperficial zone, more propitious place to the crack initiation than at the surface, where the maximum compressive stresses are located (Jia and Ling, 2007; Liu et al., 1989; Marchenko, 1990). Additionally, analyzing the equations of the wear model fitted from tribotests and of fatigue crack growth in the stable growth zone (see eqns 1, 2 and 3), a clear analogy is obtained between both phenomena (Thomas, 1974; Cho and Lee, 2000).
For the wear phenomena, a potential relationship between the variation of the worn height (Dh) with regard to a characteristic length in the direction of the traveled distance in tribotests (D1) and the applied force (F) can be set up by means of the fitting coefficients α and β (see eqn 1).
Dh / Dl = α * (F exp β) (1)
On the other hand, the wear tribotest data fitting with different functions is shown in Figure 6.
where the best data fitting is obtained with eqn (2), equation that can be directly related with eqn (1).
W / γ = 1.755 E-6 * (F exp 1.876) (2)
For the fatigue crack growth phenomena, at the stable crack growth zone, a potential relationship between the variation of the crack growth (Da) with regard to a char-acteristic length in the direction of the travelled distance (D1) and the applied force (F) can be set up by means of the material constants B’ and β’ (see eqn 3). For polymers, β’ takes values between 1.5 and 3.5 (Andrew, 1995), range in which the coefficient β of the wear equation is included.
Da / Dl = B’ * (F exp β’) (3)
2.3 Numerical implementation of the wear model
Regarding the numerical implementation of the wear model, a wear modelling strategy is proposed in order to allow dealing with very general contact geometries and conditions. This strategy uses the UMESHMOTION subroutine provided by ABAQUS, relating the material volume loss with the ablation velocity of the exterior surface, in contact to the sliding surface of the counter material. This subroutine is used in parallel to the adaptive meshing technique, smoothing meshing tool which is based on ALE techniques and is used at the end of each converged increment. This technique defines restriction velocities to the adaptive meshing zone, defined by the user, fitting the nodes of this zone and allowing the mesh to independently move with the material.
Along the numerical implementation of the wear model, two additional methodologies are developed: the first one is related to the friction model fitting from tribotest data due to the close relationship between the wear and friction phenomena in polymers, and the second one to the implementation of the wear model in an accelerated way due to the high number of cycles and long travelled distances in wear tests, so that the wear test can be numerically accelerated in a reduced number of simulation cycles, allowing the numerical implementation of the problem in a reasonable computation time. Figure 7 shows the finite element model of one of the wear tribotests. Details of this numerical procedure to implement the wear model are included in a paper submitted to the journal Tribology International, being currently under review, while details of the whole numerical procedure are included in Martínez (2010 (b)).
Regarding the numerical procedure set up to implement the wear model in an accelerated way, the first step consists in analyzing the wear curve evolution in order to check the zone with the highest wear variation. According to the obtained results, the highest wear variation is produced at the beginning of the curve, representing the running-in stage, decreasing significantly the wear rate from a traveled distance ranging from around 100 m to around 200 m, representing the stationary stage. Both stages correspond to the typical stages of a wear curve, cited in literature by authors as Zhang (1998) and Cho and Lee (2000). However, according to the results obtained from this numerical procedure, the initial running-in stage does not respond to the same reason stated in literature. Those authors concluded that the running-in stage is due to the counter material micro asperities elimination, while according to the results obtained in this work by means of finite element simulations, the initial wear is caused by the significant geometric variation of the specimen, which results from the high contact pressure distribution at the specimen at the beginning of the wear process. The stage of the highest variation of the contact pressure distribution coincides with the highest wear rate variation as well. Figure 8 and 9 show the evolution of the maximum con-tact pressure as well as the evolution of the volume loss obtained in one of the simulations carried out to state the numerical procedure of wear model implementation.
3. Sensitivity Analysis of Installation Design Variables
As sample application of the developed methodology and in order to show the application of the methodology to the design and development process of an industrial component, a sensitivity analysis of installation design variables to guide shoes wear is carried out. To do that, results of simulations of the wear process of thermoplastic polyurethane (TPU) guide shoe inserts in the guiding system of an elevator are used (see Figure 10 and Figure 11). The finite element model considers the guide shoe inserts as deformable bodies, meshed in detail, specially at the contact zones with the lift car guides, modelling the rest of the parts as rigid bodies and joining the characteristic points of the model by means of rigid beams.
In the sensitivity analysis of variables, the objective is to identify which are the most influential variables in the wear process of the guide shoe inserts and if there is any crossed effect between them. As example, this study takes as variables the relative position of the lift pull, the external load position in the platform and the guide shoes length, considering three cases for the relative position of the lift pull and two cases for the other two variables, so that 12 total cases, combining all of the variables, are taken into consideration. The relative position of the lift pull is referred in percentage as
(LPULL/LTOTAL*100, with LTOTAL the distance between guides and LPULL the distance from the lift pull position to the guide in contact with guide shoes S2-S3 (see Figure 10). Table 2 shows the different taken values for the three variables.
Each case is simulated by means of one cycle upwards and downwards, of 193 m of equivalent traveled distance in each case, with a total traveled distance of 386 m. Figure 12, 13 and 14 show, respectively, the individual results for each simulation, mean values in each variable and crossed effects, calculated as mean values between pairs of variables, in all the cases at the total estimated traveled distance of 386 m. For this last analysis, three different graphs are shown in each figure: the left upper graph represents the relationship between the load application zone (black curve for the first case and red curve for the second one) and the guide shoe length (cases in graph abscissa), the right upper graph relates the load application zone (black curve for the first case and red curve for the second one) and the relative position of the lift pull (cases in graph abscissa), while the bottom graph relates the guide shoe length (black curve for the first case and red curve for the second one) and the relative position of the lift pull (cases in graph abscissa). For more details, see Martínez (2010(b)).
The main conclusions arisen from this analysis are that the case with the highest total wear is that one corresponding to 62.5% of relative position of the lift pull, 100 mm of guide shoes length and applied load at C-D-E. Besides, comparing upwards and downwards movements, the wear in upwards movement is higher than that one corresponding to downwards movement due to the higher rotation of the lift frame in upwards case, being the relative position of the lift pull the most influential variable in the analysis of the guide shoes wear, and without presenting any crossed effect between any variable. As main conclusion, it can be said that this analysis shows the convenience and suitability of the numerical implementation tool of the wear process in the phase of design and development of an industrial component, identifying which are the most influential variables in the guide shoe insert wear.
4. Design and Development of a New Longer Stroke Tribometer
The knowledge acquired in the experimental characterization of the wear process in tribometer has been used to design, develop and start up a new tribometer, under reciprocating configuration as well, of longer stroke than that one used to characterize the wear model. This new tribometer fulfills the specifications arisen from the previous work with the aim of solving the limitations of the short stroke tribometer, already commented, trying to bring the range of working variables closer to those presented in the real component. Therefore, increasing the test stroke, the mean velocity zone is increased as well. Besides, the increasing of test stroke decreases the test frequency and therefore the temperature attained at the contact pair, variable strongly related to the material wear, is lessen. Figure 15 and Figure 16 show the longer stroke tribometer, designed for vertical loads until 1000 N, linear velocity between 0.1 m/s and 2 m/s, temperature control in working conditions from 25ºC until 40ºC and stroke varying from 85 mm up to 850 mm.
5. Conclusions
In this work, a methodology to deal with the wear problem in a sliding TPUmetal contact pair is proposed and developed from a whole numerical-experimental point of view. This procedure has been set up in different phases: a first one carried out to experimentally characterize the wear problem, a second stage of wear modelling from the previous experimental results obtained in the first phase and a third one to numerically implement the wear model. Additionally, as fourth stage, an example of application of this methodology in the design and development process of an industrial component is presented as well, with the sensitivity analysis of several installation design variables, showing the convenience and suitability of the numerical implementation tool of the wear process of an industrial component, identifying which are the most influential variables in this process. As future actions, and by means of tests with the longer stroke tribometer already started up, the main activity is related to accelerate the wear tests, bringing it nearer to the working conditions of the real application.
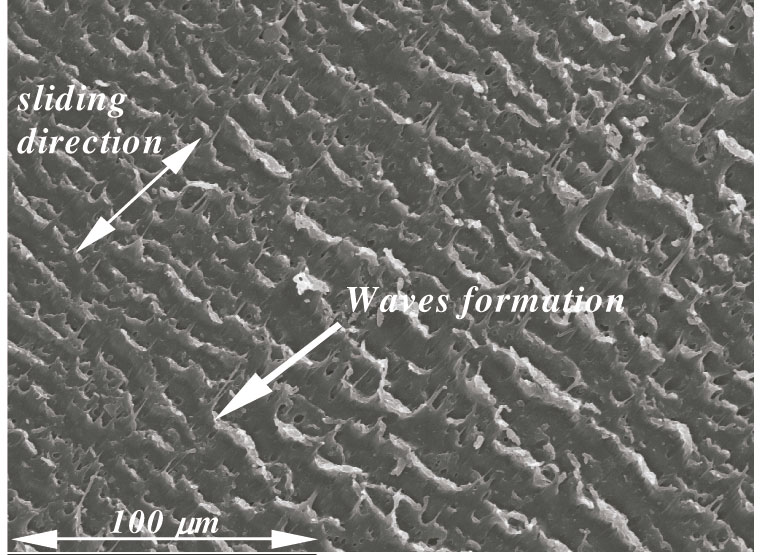
Figure 2. Observations by SEM. Waves formation in the TPU worn surface 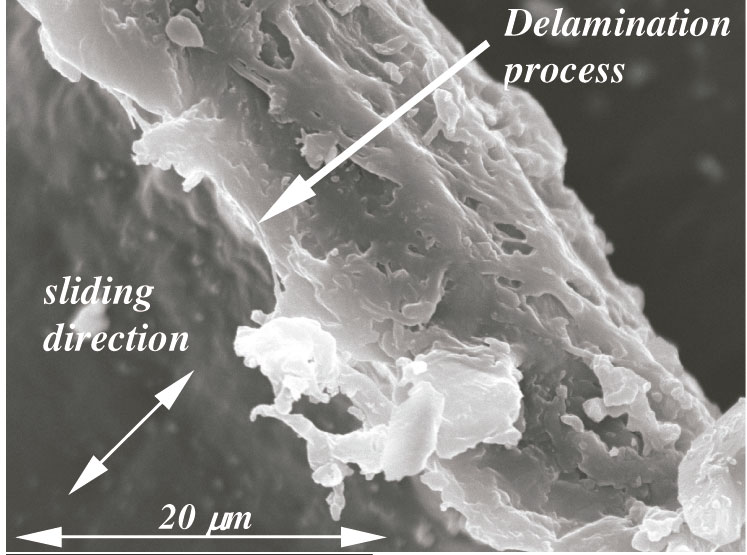
Figure 3. Observations by SEM. Delamination in the TPU worn surface 
Figure 4. Distribution of shear stresses in finite element analysis of the wear tribotests at the contact pair 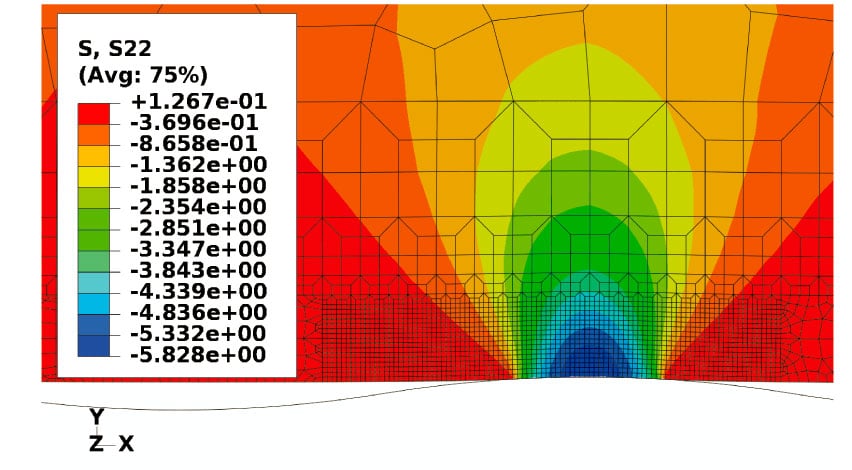
Figure 5. Distribution of compressive stresses in finite element analysis of the wear tribotests at the contact pair 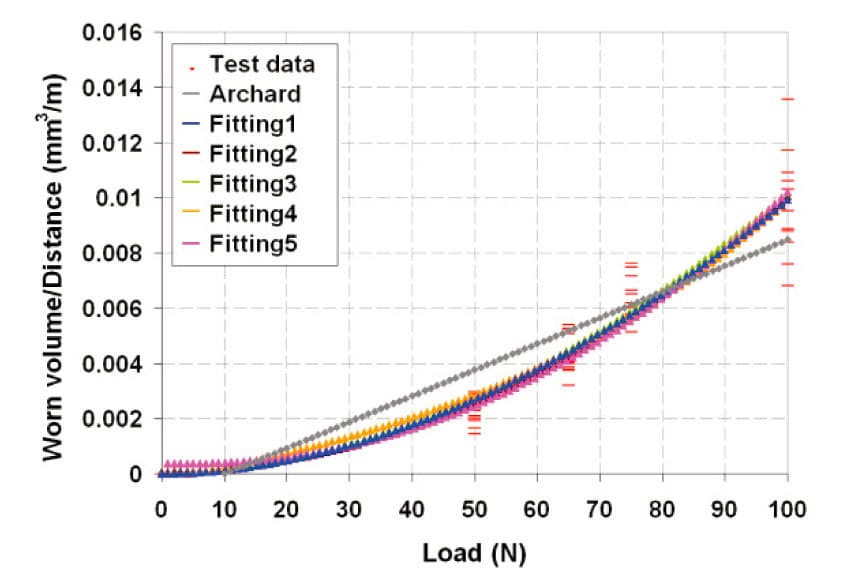
Figure 6. Wear tribotest data fitting 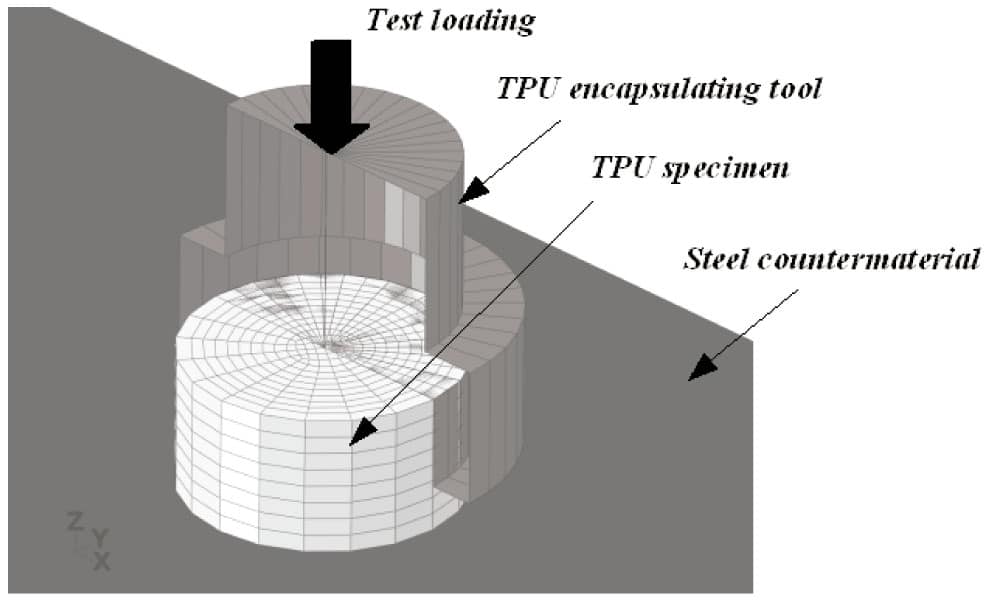
Figure 7. Finite element model of one of the wear tribotests 
Figure 8. Maximum contact pressure evolution versus the travelled distance obtained by means of FEA simulations Figure 9. Volume loss evolution versus the travelled distance obtained by means of FEA simulations 
Figure 10. Finite element model of the elevator 
Figure 11. Finite element model of one of the guide shoe inserts 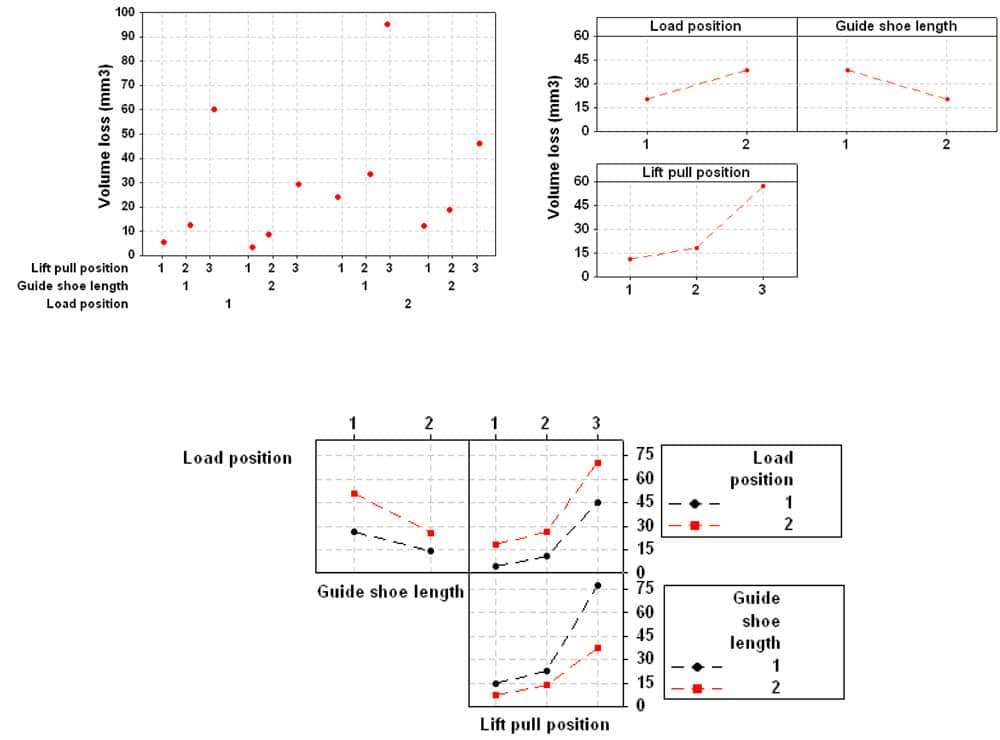
Figure 12. Individual wear values Figure 13. Mean wear values for each variable Figure 14. Crossed effects (ordinates in volume loss, mm3) 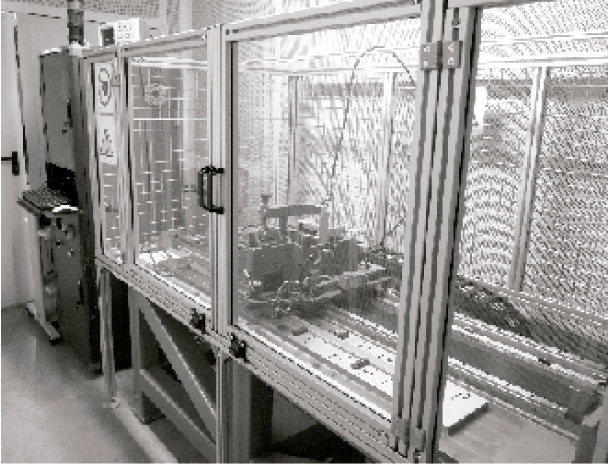
Figure 15. Longer stroke tribometer. Whole view 
Figure 16. Longer stroke tribometer. Detailed view 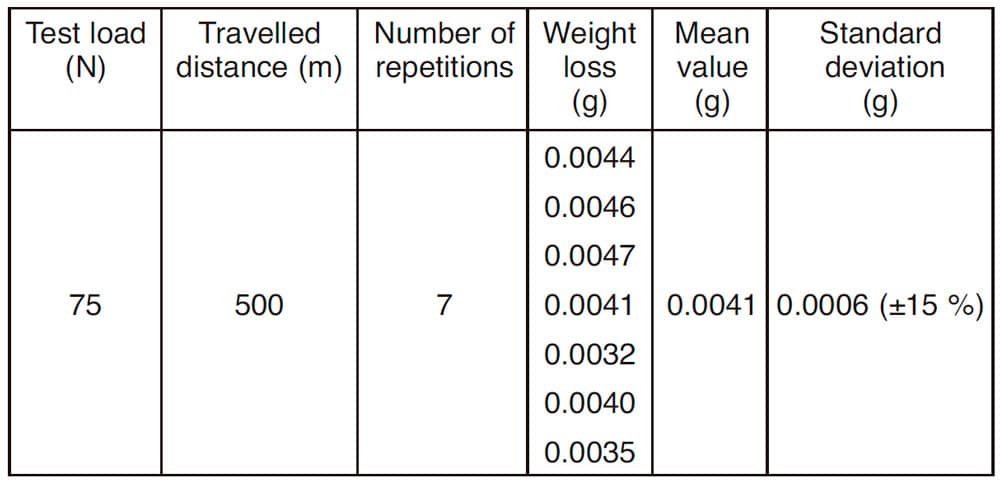
Table 1. Example of results under specific conditions of 75 N of load and 500 m of travelled distance 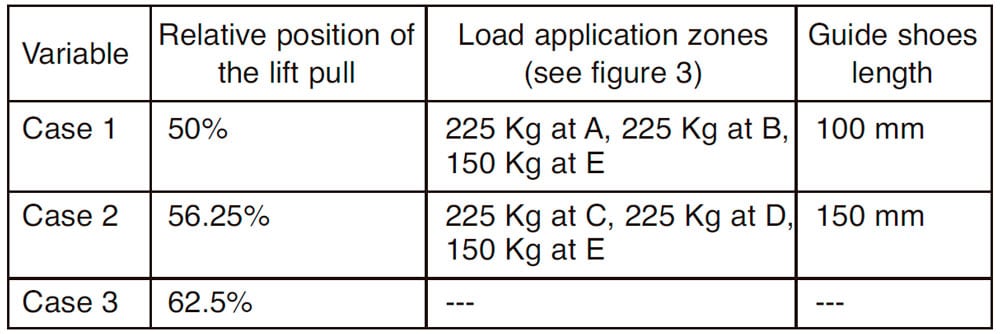
Table 2. Values of the variables in the sensitivity analysis
REFERENCES
[1] Martínez, F.J., Canales, M., Bielsa, J.M., Jiménez, M.A. (2010). Rela-tionship between wear rate and mechanical fatigue in sliding TPU-metal contacts. Wear, 268, pp. 388-398.
[2] Archard, J.F. (1953). Contact and rubbing of flat surfaces. J. Appl. Phys., 24, pp. 981-988.
[3] Greenwood, J.A., Williamson J.B.P. (1966). Contact of nominally flat surfaces. Proc. R. Soc. Lond., 19, pp. 295-300.
[4] Sarkar, A.D., (1980). Friction and wear. London: Academic Press.
[5] Molinari, J.F., Ortiz, M., Radovitzky, R., Repetto, E.A. (2001). Finite element modeling of dry sliding wear in metals. Eng. Comput., 18, pp.
592- 609.
[6] Liu, R., Li, D.Y. (2001). Modification of Archard’s equation by taking account of elastic/pseudoelastic properties of materials. Wear, 251, pp. 956-964.
[7] Bartenevev, G.M., Lavrentev, V.V. (1981). Friction and wear of poly-mers. Tribology, Tribology Series, no. 6, Elsevier Scientific Publishing Company, 10-260.
[8] Johnson, K.L. (1995). Contact mechanics and the wear of metals. Wear, 190, pp. 162-170.
[9] Suh, N.P., Mosleh, M., Arinez, J. (1998). Tribology of polyethylene homocomposites. Wear, 214, pp. 231-236.
[10] Da Silva, R.C.L., Da Silva C.H., Medeiros, J.T.N. (2007). Is there delam-ination wear in polyurethane? Wear, 263(7-12), pp. 974-983.
[11] Jia, X., Ling, R. (2007). Two-body free-abrasive wear of polyethylene, nylon 1010, epoxy and polyurethane coatings. Tribology international, 40(8), pp. 1276-1283.
[12] Liu J.J., Zhou P.A., Sun, X.T., Liao, Q.C. (1989). Adhesive wear and fatigue wear of materials, [13] Beijing: Machinery Industry Press, pp. 234-323. Marchenko, E.A. (1990). Essentials of friction breakage for metals surface, Beijing: National Defence Industry Press, pp. 1-8.
[14] Thomas, A.G. (1974). J. Polym. Sci. Symp., 48, p. 145.
[15] Cho, K., Lee, D. (2000). Effect of molecular weight between cross-links on the abrasion behaviour of rubber by a blade abrader. Polymer, 41 (1), pp. 133-140.
[16] Andrew, W. (1995). Fatigue and Tribological Properties of Plastics and Elastomers. Plastics Design Library, VI.
[17] Martínez, F.J. (2010). Development of a numerical-experimental method-ology as support tool for the system design with thermoplastic-metal reciprocating contact presence. PhD Thesis, University of Zaragoza, 234pp.
[18] Zhang, S.W. (1998). State-of-the-art of polymer tribology. Tribology International, 31 (1-3), pp. 49-60.
Get more of Elevator World. Sign up for our free e-newsletter.


