State-of-the-Art Traffic Analysis
Sep 1, 2011
This paper was presented at  Lucerne 2010, the International Congress on Vertical Transportation Technologies and first published in IAEE book Elevator Technology 18, edited by A. Lustig. It is a reprint with permission from the International Association of Elevator Engineers
  (website: www.elevcon.com). This paper is an exact reprint and has not been edited by ELEVATOR WORLD.
A simple and reliable method for traffic analysis based on simulations.
Abstract
In earlier days, traffic analyses for the design of elevator groups had been based on simple assumptions: Morning up-peak traffic conditions and conventional dispatching systems. It is known that today both assumptions must be revisited: Analyses must also cope e.g. with lunch time traffic conditions and with destination control systems. Therefore, simulation methods are now widely used. However, there are various ways how simulations can be applied, which can be confusing. We discuss differences of various approaches and present a method for traffic analyses based on simulations which is as simple and reliable as possible.
1. Introduction
1.1 The Goal of Elevator Planning
The planning of large buildings incorporates, among many other things, a proper design of the elevator system. The elevators must be capable to transport all passengers at a reasonable service level, also in peak hours. If there are not enough elevators, passengers experience long waiting times or will have to queue in peak hours; other-wise, too many elevators may be a waste of space and money. Therefore, it is essential to know before construc-tion how a specific elevator system will perform under different conditions: What is the maximum handling capacity of the elevator system in a specific traffic situation, such as morning uppeak or lunch? What are the waiting times for a certain arrival rate of passengers and a specific traffic situation?
1.2 A New Area of Building Planning
Since the introduction of Schindler’s destination control Miconic 10® in 1996, the planning of vertical transportation in buildings has seen a dramatic change. Destination control has not only changed paradigms of how elevators are used, but also how buildings are planned. We do not only see a much higher efficiency of elevators systems and building layouts that would not have been feasible before. Now, the elevator group control itself can make the difference between “it works” and “it does not work”. The quality of service is very different from one group control to another – the difference never had been as big as today.
Earlier planning instruments based on the fact that all controls delivered essentially the same performance, and a simple up-peak calculation formula could be applied. Nowadays, simple calculations lead nowhere: Even if the performance of an advanced destination control system could be described by some formula, it would be useless for any other control. If nevertheless the building was designed based on some calculation, it would either have too many or too few elevators – a waste of money and not to be called “planning”.
1.3 The Main Problem with Most Traffic Analyses
Today, simulations are widely used for traffic analyses, as it has more generally been recognized that this is necessary. However, simulation methods are often very poorly applied. The main problem comes from the fact that results often completely lack statistical relevance – just not enough data points are being considered for evaluation. Although this problem is known for a long time in general and also specifically in the elevator industry, it is widely ignored. It is the main purpose of this article to address this issue.
1.4 Scope of this Article
Although elevator planning is not trivial at all, the actual step of producing qualifying results by traffic analyses does not need to be overly complex, obscure, and error prone. Various methods had been discussed in the past, however, rather adding more confusion than insight. The goal of this article is to explain the basic requirements for traffic analyses and why we see a large variation of results from different methods. Furthermore, we discuss how traffic analyses preferably are done. We do not claim that our methods are new; in contrast, they had been applied successfully within Schindler now for years. Furthermore, the elements of our methods have been publicly known and discussed before; however, a coherent presentation was missing so far, and the present article is aimed to close this gap.
2. Principles And Requirements For Traffic Analyses
2.1 General Principles
In the context of this article, we consider a group of elevators and passengers using this group. We assume that the elevator group is fully specified, e.g. in terms of maximum car load capacity, door opening and closing times, drive speed, acceleration and jerk etc. Also, the elevator group control has to be available (see also discussion in Section 2.3). The requirements of the passengers are usually referred to as traffic; typically this is a list of the passengers’ calls, each call determined by its time, origin and destination floor. Furthermore, it must be specified how long it takes for a passenger to board or alight a car; typically, 1 second per person is taken into account.
The question of what traffic should be considered requires expertise, which would be beyond this article to discuss in detail. Generally, the population of the building and its distribution per floor is considered, as well as special functions in the building like restaurants or parking areas. Based on this distribution of population and the building’s functions, traffic flows are established, typically depending on the time of day.
Given all specifications as above, the traffic analysis has to apply a method which should answer the main questions, which could be: What is the maximum handling capacity of the elevator system for a given traffic situation? What are the waiting times for a certain arrival rate of passengers and a specific traffic situation?
2.2 Detecting Saturation
Every elevator system will serve the passengers very well if only few passengers use the elevators. As more and more passengers arrive, waiting times will increase. At a certain point the system will saturate and waiting queues occur, which is an undesirable and unwanted situation. A traffic analysis should detect saturations, how-ever, most methods are not capable to reliably do this, as we will discuss in the following.
For clarity, we add some technical notions and explanations related to the topic of saturation.
Arrival rate is the frequency of passengers’ calls, technically measured by counting the number of calls within a longer time period and then expressed as an average number of calls per 5 minutes.
We say that an elevator system saturates when, for a conventional up-down button system, not all passengers are able to board the first arriving elevator car serving their direction or, for a destination control system, not all passengers receive an immediate allocation to an elevator which will serve them at next arrival on the calling floor.
As long as there is no saturation, all passengers are served as expected; in this case the arrival rate is also the frequency of served passengers, which we call handling capacity.
The maximum handling capacity of an elevator system is the highest arrival rate without saturation. It should be noted that the maximum handling capacity depends on the traffic situation, e.g. morning up-peak and lunch time situations etc. have all different maximum handling capacity. Without exact definition of the traffic it is meaningless to specify a maximum handling capacity.
2.3 Realistic and Reliable
As discussed in Section 1.2, elevator group controls have a big impact on handling capacity and service quality. Therefore, a realistic traffic analysis must reflect the actual elevator group control: There is no other way as to run simulations which use the actual control algorithms of the elevator group.
Furthermore, results of a traffic analysis must be reliable, which means that the results are reproducible and unbiased. Reproducibility is challenged by randomness, which is an important element in simulations. We will see that it is not so difficult to cope with this, once the problem is understood. Simply speaking, the variation must be aver-aged out by considering a sufficiently large set of sample data points.
Finally, for practical reasons a traffic analysis should be as simple as possible, not requiring unnecessary com-plex steps.
3. Simulation Based Methods
3.1 General Principles
All simulations for traffic analyses have in common that they model elevators and passengers by software. The state of elevators and passengers, e.g. their position in the building, is continuously changed as time evolves. A simulation typically starts with elevators empty, e.g. parked at ground floor. Beginning with a first and then all further modeled passengers, calls are made and allocated to the elevators, based on the real group control. Eleva-tors operate doors and move from floor to floor in the model as they would in reality. Typically, the simulation stops when the last passenger has been served and all elevators are idle again. During the simulation, a clock representing the time makes sure that all events are at the correct time and speed.
3.2 Generation of Calls
While the behavior of the elevators is normally deterministic, the passengers’ calls are purposely generated by use of randomness. This is done to reflect the real situation in the building: While daily traffic characteristics such as the average arrival rates or the relative distribution of calls per floor repeat at least to some extent, the passengers arrive in a different sequence and at different times every day. Therefore, once the general traffic characteristics have been selected based on expertise, the actual call sequences are generated as randomly as they are in reality. That means that the calls should not be placed e.g. at fixed intervals but following a so-called Poisson process, which is known to model the arrival of independent passengers well; see Figures 1 and 2 for illustrations.
A call generation process which is not a Poisson process would at least require justification and is expected to lead to biased results. When calls are not placed randomly but instead at selected times, it is not difficult to produce good looking results. We assume for the following that a Poisson process is applied.
In addition to the distribution of the call times, also the calls’ origin and destination floors should be selected at random, where a floor’s probability depends on the distribution of the population in the building.
3.3 The Law of Large Numbers
The random element in state-of-the-art methods used for traffic analyses does not mean that the results will not be reliable. In contrast, it has been recognized early that large samples of data may lead to more precise results.
There exist several very old sources of such observations, e.g. one from the Greek historian Thucydides (c. 460 BC – c. 395 BC). It took a long time to develop a theory of statis-tics, and it was the Swiss mathematician Jacob Bernoulli (1654 – 1705) which gave a first proof of what is called today the law of large numbers.
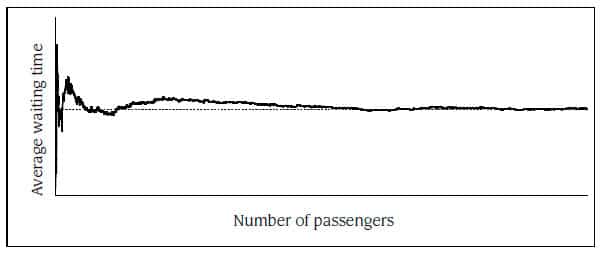
The law of large numbers is a mathematical theorem. It states that with more and more data points in a statis-tics the average value approaches a certain value, i.e., randomness becomes more and more insignificant. For illustration, we show in Figure 3 the average waiting time of an increasing number of passengers; for a small number of passengers, there is a high variation in average waiting times, whereas for a larger number there is almost no variation left.
The law of large numbers and further theorems from statistics allow precise predictions how reliable the results of simulations are. As a rule, precision of results is doubled when the number of data points is increased by a factor of four: For traffic analyses based on a constant arrival rate, the average waiting time results of a 2-hour simulation period are twice as precise as for only 30 minutes duration.
Special and important cases are situations with saturation (see Section 2.2). There, the law of large numbers is not applicable when waiting queues build up and statistical values depend on the duration of the simulation. However, this is not a problem: As saturation represents an undesirable situation, the corresponding results are not needed for statistical evaluation – in fact, this would be meaningless and misleading.
3.4 Some Examples of Simulation Based Methods
The examples discussed in this section are all typical cases found in the elevator industry. We give indications when and why these examples should not be followed. Our proposed and proven method is discussed in Chapter 4.
The main problem which can occur with simulations is that results look very different although they should be based on the same assumptions. In fact, some differences come from the simulation methods; this is unnecessary and should be avoided. Because of the law of large numbers, we know that it is essential to consider enough passengers for the results. We will also discuss further problems which come with some weak simulation methods. The technical elements of the following discussion are not new and have been touched partially in presentations of various sources; however, a clear explanation why some methods are preferable and some should be avoided was still missing.
3.4.1 Constant Arrival Rate
Simulations with constant arrival rate represent the easiest case. Here, the intended arrival rate is set to a fixed value and kept during the whole simulation period (see Figure 4). As discussed before, a Poisson process should be applied; this naturally leads to a variation in the actual arrival rate. Therefore, when simulation is evaluated, the actual number of passengers must be counted and reported in the traffic results.
According to the law of large numbers (see Section 3.3), a longer simulation period will lead to more precise results. Of course, this is not true when a short evaluation period is selected, e.g., when only 30 minutes out of a long simulation are considered for the results. Similarly, preciseness is reduced when only some of the passengers (e.g. all calls from a specific floor) are considered.
As a general rule, the special and favorable conditions at the beginning and ending of a simulation should be excluded from the results, i.e., corresponding passengers are not considered in the results. We recommend excluding the first 15 minutes of a simulation, be-cause at the beginning all cars are empty and usually positioned at ground floor. Therefore, the first passengers will experience short waiting and travel times, and elevators may not be distributed in the building as it is typical for the selected traffic situation. Also the ending of the simulation should be excluded: When no more calls are given, the last passengers will experience faster travel. We recommend either to exclude all passengers which have not reached their destination at the time of the last call, or simpler, to exclude the last 5 minutes of the simulation when all passengers reach their destination within that time.
Using a constant arrival rate is a good idea: It is simple and clear what is done. However, also with this type of simulation meaningless results can be produced. We have often seen that the simulation time has been set to short 15 minutes and evaluation has not excluded beginning or ending. By this, e.g. average waiting times have been significantly smaller than what they are on a longer run. Paradoxically, often such simulations are being repeated e.g. 10 times “in order to average out errors”. Of course, the systematic errors are just repeated. We recommend everybody to do the experiment and see the difference to the results obtained from one simulation running 10 x 15 = 150 minutes, excluding the first 15 minutes and the last 5 minutes.
3.4.2 Continuous Increase
One goal of traffic analyses is to find the maximum handling capacity for a given traffic situation. It is rather straightforward to come up with a simulation method which takes up this idea: The arrival rate is increased continuously as time advances (see Figure 5).
Provided that the increase is slow, this method works fairly well as long as the system is not close to or in saturation. However, the method is rather weak in order to determine maximum handling capacity or in order to find reliable values close to saturation. This comes from the following three problems:
- Close to or in saturation every system has a high variation, i.e., waiting times are distributed from small to very large. Therefore, a long evaluation period is needed to obtain reliable measures.
- The method is biased, i.e., every passenger profits at the time of the call that in the past the arrival rate was smaller. With faster increase of arrival rate also the bias becomes larger, and results may become optimistic.
- Evaluation periods tend to be short. Typically, the selected increase is too big to have evaluation periods longer than 30 minutes, or the bias within the evaluation periods becomes even larger.
Altogether, there is a high chance to miss the actual point of saturation and to report a maximum handling capacity which is too high. However, this is a contradiction to the original idea of the method. Furthermore, typically too short evaluation periods are selected, which leads to a high variation in the results if not to biased values.
3.4.3 Stepwise Increase
Another approach which is somewhat similar to the continuous increase is a simulation by stepwise increase: The arrival rate is first kept constant at a first value, then at a next higher value for the same time, etc. (see Figure 6).
One could consider this as a mix of constant arrival rate and continuous increase. However, practical applications are observed to be almost ridiculous: Steps are kept for 5 minutes only, and the total simulation time is at about 60 to 90 minutes; when results are obtained from one of the steps, they are based on a much too short time period. But also if longer time periods are applied, the method suffers from all the problems discussed above:
- Values close to or in saturation are not reliable.
- The method is biased, e.g. when a time period with constant arrival rate is evaluated, the values are influenced by the steps before and after this time period.
- Evaluation periods tend to be short.
In sum, this method looks more promising than it is.
Even when applied with very long step duration, there is no advantage as compared to the method which we discuss in Chapter 4.
3.4.4 Peaks and Day Profiles
Popular simulation methods are those which try to be very realistic: Peaks of various types (for illustrations see Figure 7) or other non-constant traffic profiles (see Figure 8), e.g. profiles which model a full day of traffic.
These methods are not only unnecessarily complicated because of all the data required to define the simulation over time, they are also misleading with respect to being realistic – they are usually either very unrealistic (peaks designed as in Figure 7) or too specific (as in Figure 8) to be applied for a different project than that where data had been collected from. However, the biggest drawbacks are:
- Often the evaluation periods are very short and results lack statistical relevance.
- These methods are useless for finding the maximum handling capacity of an elevator system.
- The actual generation of the traffic is not easy when it should be as natural as in a Poisson process. It is very likely that here unwanted errors are introduced.
- It is likely that results are biased in one or the other way, as the selection of the evaluation period influences the results.
4. How To Use Simulation In Traffic Analyses
4.1 The Method
We present a method which is based on simulations but is not affected by the drawbacks discussed above. Schindler is successfully using this method for years now. Similar methods may have been used by others as well. The method is rather simple:
- For various values of arrival rate, do simulations with constant arrival rate as suggested in Section 3.4.1: Each simulation lasts at least 2 hours, the first 15 minutes and the last 5 minutes are excluded in evaluation.
- Whenever saturation is detected, the results are discarded and not reported. This is done because saturation is not desirable at all, and including them in the results would be misleading (see also Section 3.3 for more details). The results can contain various values, which are obtained from the individual simulations.
Please note that all simulations in a series follow the same traffic situation, e.g., the whole series is for a morning up-peak, or for a specific lunch traffic situation etc. 4.2 Example
We consider a specific elevator group in a building, where population and building functions have been analyzed. Based on expertise, one or several traffic situations had been selected for the traffic analysis. For an office building this would e.g. include a specific lunch time traffic situation. For each of the selected traffic situations, a full series of simulations is done and evaluated as stated in Section 4.1.
For illustration, we consider a graphical representation as in Figure 9. For each simulation in the series we can determine the actual handling capacity (see Section 2.2) and e.g. the average waiting time. The result from each simulation can be represented by a dot placed accordingly in the chart as in Figure 9. All results may be connected by a line for better visibility. The right-most result comes from the simulation that was done with an arrival rate at maximum handling capacity. A further increase of the arrival rate would lead to saturation (see Section 2.2); thanks to the long simulation run, this is detected and the simulation is not included in the results.
4. Discussion
The method as presented in Chapter 4 is most simple and straightforward. Confusion with respect to the defini-tion of traffic or evaluation of results can be avoided. Most important, the drawbacks of other methods are avoided, because this method is based on a safe and scientifically proven theory and on our long experience from practice.
The method comes with all desired properties:
- Maximum handling capacity is determined.
- Reported values are as reliable as wanted – for more precision longer simulation runs can be done.
- The method is not biased because of special conditions at beginning or ending of a simulation run, or because of the effects coming with non-constant arrival rates.
- The method avoids unnecessary complexity.
In addition, the method turns out to be of great practical relevance when compared to real buildings.
5. Summary
State-of-the-art traffic analyses must be based on simulations. Thanks to the law of large numbers (see Section 3.3), there exists a simulation-based method (see Chapter 4) which has all favorable properties we are looking for (see Chapter 5). We also discussed other methods and possible shortcomings (Section 3.4).
Overall, traffic analyses require a lot of expertise and are not simple at all; however, the technical step of producing values for a given elevator and traffic configuration does not need to be difficult or error prone. This article presents a valid method for this step, making it simple and reliable. Adopting this method will help to reduce unnecessary confusion and to improve reliability of traffic analysis results.

Figure 1. Calls at regular intervals – not to be used 
Figure 2. Calls as naturally distributed (Poisson process) 
Figure 4. Constant arrival rate 
Figure 5. Continuously increasing arrival rate 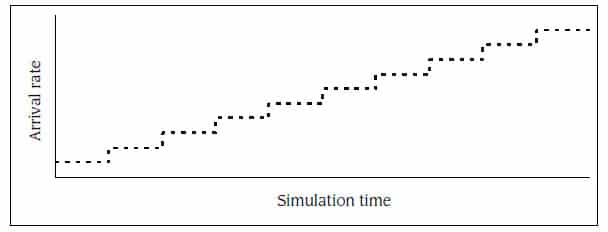
Figure 6. Stepwise increasing arrival rate 
Figure 7. Peak arrival rate profiles 
Figure 8. Non-constant arrival rate profile 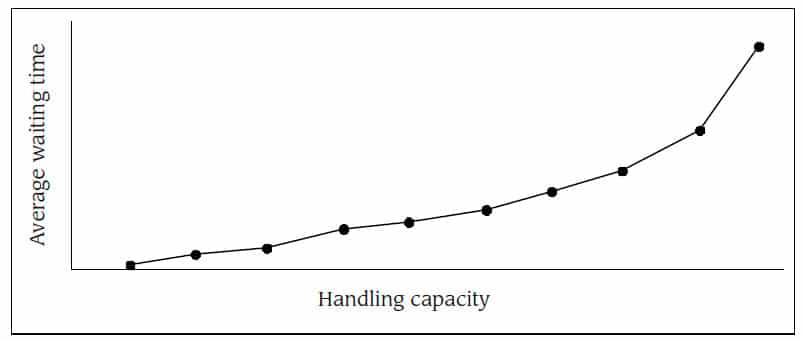
Figure 9. Average waiting times in function of arrival rate
Get more of Elevator World. Sign up for our free e-newsletter.


