This paper was presented at  USA 2012, the International Congress on Vertical Transportation Technologies and first published in IAEE book Elevator Technology 19, edited by A. Lustig. It is a reprint with permission from the International Association of Elevator Engineers
  (website: www.elevcon.com). This paper is an exact reprint and has not been edited by ELEVATOR WORLD.
Key Words: Simulation, elevator traffic, dispatching, waiting time
Abstract
Performance variation is inherent to elevator dispatching because one of the key inputs to dispatching analysis, the relevant traffic, varies day to day, hour to hour, and even minute to minute. This paper discusses how elevator simulators use traffic patterns, the impact of traffic variation on simulated elevator performance metrics, and shows that, unlike traditional handling capacity calculations, elevator simulation does not automatically “average out” the effects of traffic variability.
1. Introduction
For over 90 years, the elevator industry has used probability formulas to calculate how many people can be handled by a given elevator system configuration. Elevator experts review the calculated values and compare them to industry norms to evaluate the quality of the proposed elevator system.
The relevant formulas, based on elevator round trip calculations, are mathematically straight forward, widely available, accepted in both commercial and academic settings and can be executed with a piece of paper and pencil, a calculator or a simple computer program or spreadsheet implementation. Round trip time formulas and handling capacity equations are well documented (Examples include Barney 2010; Barney and dos Santos 1985, and Strakosch 1967). Although there may be slight variations among implementations, similar results are produced when similar inputs are employed, and significant differences in a calculated value can usually be easily explained by a difference in the relevant inputs.
Over the past two decades, elevator simulation programs, programs that duplicate elevator behavior using sophisticated computer programs, have become increasingly common. The elevator industry now routinely expects elevator manufacturers to provide elevator simulation results as part of the bid process for both new equipment and modernization jobs. Elevatoring experts now review simulation results, as well as calculated results, to evaluate elevator systems.
Unlike the traditional formulas, elevator simulators are complex, often expensive, programs that may not be widely available. Elevator simulators are often created by elevator manufacturers and may rely heavily on proprietary dispatching algorithms. Elevator simulators use traffic demand as input rather than calculating it as output. Unlike probability formulas, which “average out” variation and produce expected values for traffic handling, a single simulation gives precise information about a single detailed scenario.
As Dr. Richard Peters notes, “Since widespread introduction of simulation tools, one of the challenges for the lift industry internationally has been trying to reach a consensus on how to apply simulation” (Peters, 2010). Lulled by the simplicity of the traditional formulas, in which the dispatching assumptions do not vary, one might easily assume that differing results from different simulators can be attributed to the efficiency of the dispatcher when, instead, the differences might be due to subtle discrepancies in the inputs used.
Elevator simulators allow for much more precision in input definition than do the probability formulas, and developing the traffic demand information for a simulator is more difficult than defining formula inputs. Since elevator dispatching can be very sensitive to even small changes in passenger demand, simulation results can vary significantly depending solely on the specifics of the input.
2. Traffic Patterns
One of the key inputs to an elevator simulation is passenger demand, also known as elevator traffic. Computer simulation programs mimic some type of physical reality, and in the elevator world that means that a simulator creates a software version of a specific building, including the number, motion profile and size of the elevators and which floors in the building are served by those elevators. In order to model the interaction of the elevator system with the passengers using the elevators, the simulator must be able to model the passenger demand. Elevator simulators use traffic inputs, including the number of people using the elevators and their arrival rates, to represent the passenger demand.
Elevator traffic is frequently depicted in histogram form, as shown in Figure 1. The histogram is often called a traffic pattern and is usually designated in five minute intervals. The use of five minute intervals is a holdover from the traditional formulas that calculated handling capacity for a five minute window. Each bar on the histogram indicates the percentage of the building population that will arrive at the elevators during the represented five minutes. In Figure 1, for example, 4% of the building population is arriving at the elevators in the first five minutes of the pattern period, 5% are arriving in the second five minutes, etc. Since traffic patterns are expressed in percentages of building population, the same traffic pattern applied to different buildings will represent a different number of people. Table 1 shows the difference in actual number of passengers requesting elevator service between Building 1, with a total population of 1000 people, and Building 2, with a total population of 700 people. Although both buildings experience the same traffic pattern, Building 1 has 330 passengers using the elevators during the half hour period represented by the pattern while Building 2 has only 231 passengers during the same time period.
3. Traffic Pattern Comparisons
While it may seem obvious that the traffic pattern has a significant impact on an elevator simulation study, it is often the case that traffic patterns are not clearly specified by those requesting elevator simulation studies or by those providing simulation results. Elevator simulation results should always be quoted with reference to the underlying traffic pattern. Consider, for example, receiving a simulation study that tells you that the average waiting time (AWT) for a four car group is 28.7 sec. If that AWT represents an average when 20% of the population is using the elevators it may indicate very acceptable performance. If, on the other hand, the AWT represents a time when only 3% of the population is using the elevators it may be an indicator of poor performance. In order to correctly evaluate simulation results the relevant traffic pattern must be considered.
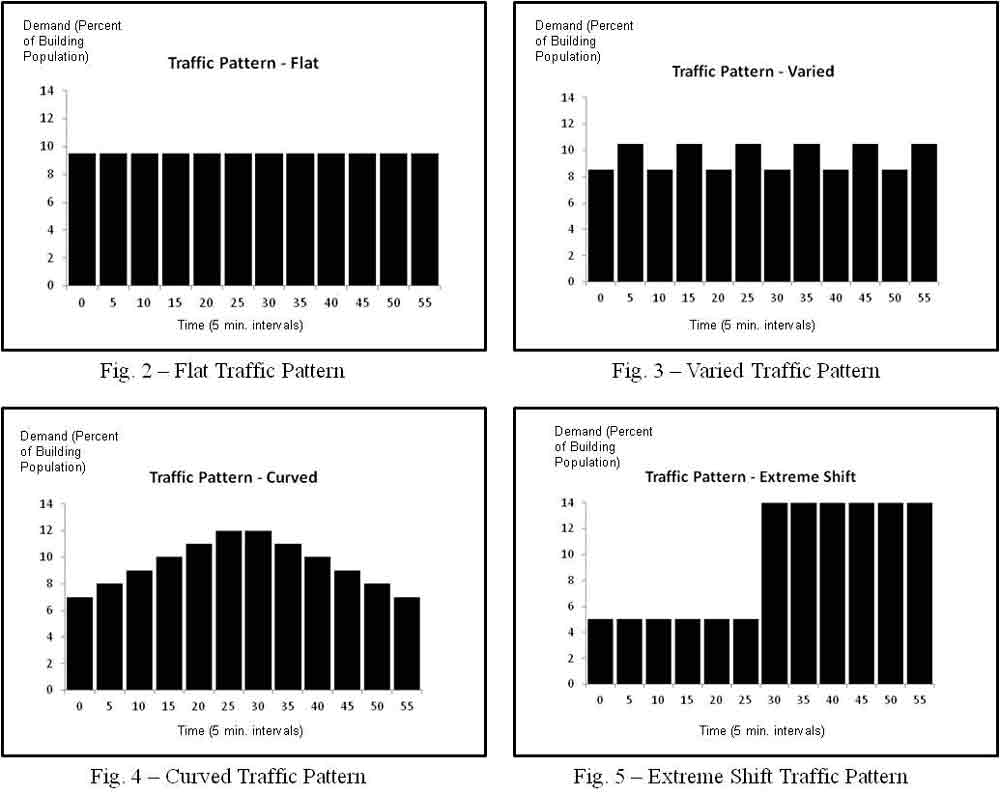
Figures 2 through 5 and Table 2 illustrate the impact that different traffic patterns have on simulation results. All four of the traffic patterns represent the same number of passengers and all represent passenger demand of 114% of the building population in one hour. But the passenger arrival rates are different in each traffic pattern, and Table 2 shows different performance metrics for each traffic pattern. The data in Table 2 was derived by using an elevator simulator in which all aspects of the simulation were held constant except for the arrival rates of the passengers using the elevators. In some cases, the difference between the performance results is quite significant, indicating how important it is to understand and accurately depict the traffic pattern.
4. Traffic Lists
After looking at the examples in the previous section, it should be obvious that the traffic pattern is a key simulation input and should be specified. It may not be obvious, however, that there is still significant variation related to a single traffic pattern. Elevator patterns are used to describe a high-level characteristic of people using elevators, the overall arrival rate of those passengers. For example, it may be that in a particular building the overall arrival rate tends to be the same day after day, Monday through Friday. Perhaps in that building, at around 8 AM in the morning, about 4% of the building population arrives in the lobby, followed by 5% five minutes later, 6% five minutes after that etc. In fact, the traffic pattern shown in Figure 1 might apply to this hypothetical building. But the traffic pattern does not account for the fact that hypothetical Mr. Brown, who usually shows up right around 8 AM and counts as part of the initial 4% of the building population, does not actually arrive at the same exact second each day. On a particular Monday, for example, he may press the elevator hall call button at 8:01:30 AM, but on Tuesday it might be 8:03:22 AM. Similarly, Mr. Brown’s arrival may be time-stamped differently each day even though he tends to arrive between 8 AM and 8:05 AM.
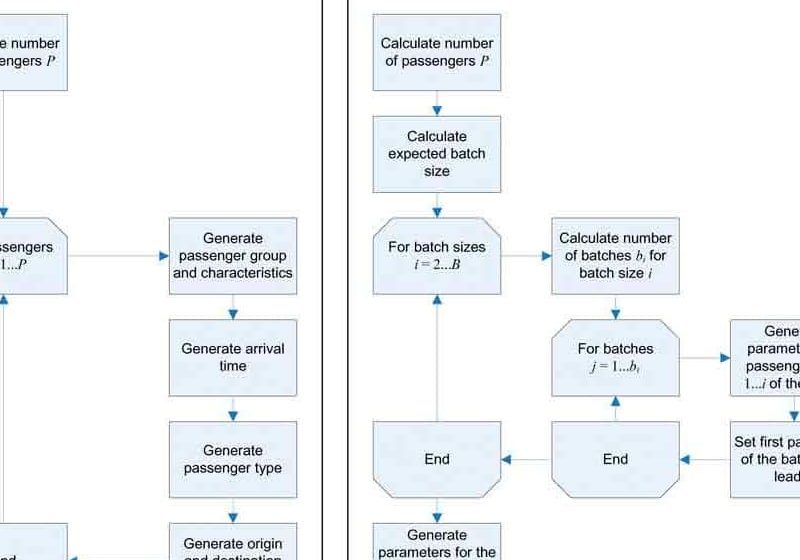
Elevator simulators need to know exactly when a passenger arrives at the elevators so that it can send a simulated elevator to serve the simulated passenger. Therefore, most elevator simulation packages include some type of passenger generation module that accepts the histogram based traffic pattern as input and generates an exact passenger list from the traffic pattern. The passenger list, which includes an exact arrival time, origin floor and destination floor for each passenger, will be used as specific input data for the simulation engine that models the elevator behavior and collects performance statistics. Some simulators include other factors, such as the weight of a passenger or how fast he or she walks, in their passenger lists.
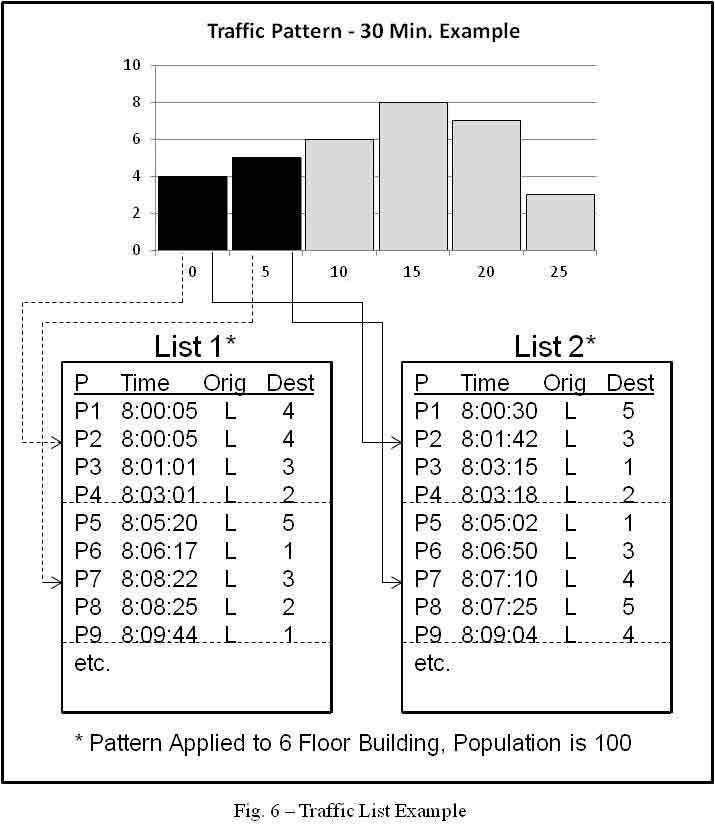
Multiple traffic lists can be generated from a given traffic pattern and most passenger generation modules use some type of random number generator to develop passenger lists from traffic patterns. A traffic list must maintain the characteristics of the traffic pattern in that it must have the correct number of people requesting elevator service within the five minute periods. But, the arrival order of the passengers within that five minutes and the origin/destination combinations associated with those passengers may vary. Figure 6 illustrates two separate passenger lists that could be derived from the example traffic pattern of Figure 1. These two lists are only two of many that could have been derived.
Often an elevator simulator will also have some means of inputting the distribution of origin/destination combinations, and the traffic lists created will reflect the requested distribution. As with arrival times, the exact origin/destination combinations may be different in different traffic lists.
Differing traffic lists can lead to differing performance results, despite the fact that both lists represent the same underlying traffic pattern and origin/destination percentages. This is one reason why it can be misleading to compare simulation results from different simulators. Although both simulators may be using the same traffic pattern, origin/destination probabilities, elevator characteristics and building parameters as input, unless the traffic list has been exactly specified the different simulation studies are most likely based on different traffic lists.
5. Traffic List Variation
5.1 Small Change in a Single Traffic List
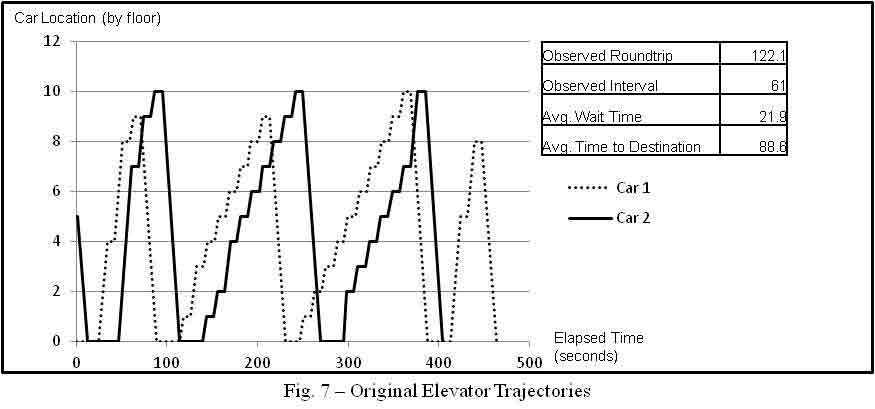
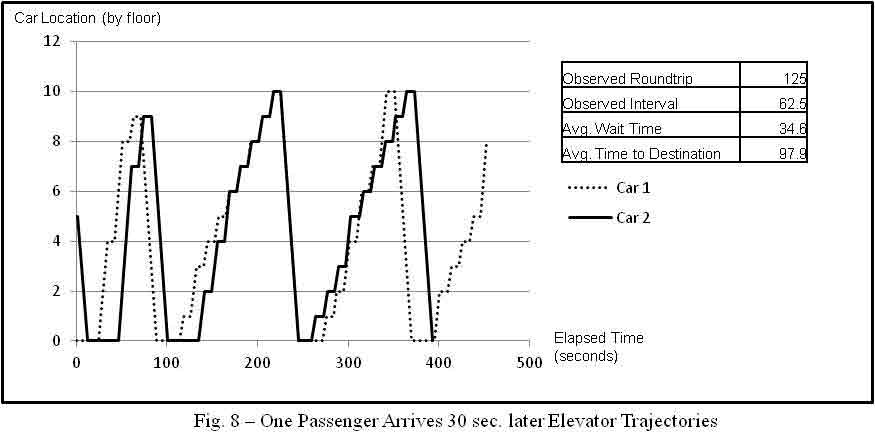
Small changes in the traffic distribution can result in significant changes in measured elevator performance, which means that the actual traffic list is an important consideration. To illustrate this, Figures 7 and 8 show the elevator trajectories for two different scenarios. Both scenarios are based on a five minute traffic list being served by two cars in a building with ten floors above the lobby floor. The five minute traffic list is the same in both cases, with the exception of one passenger who arrived 30 seconds later in the Figure 8 scenario than he did in the Figure 7 scenario. All other passengers arrived at the exact same time, and all other parameters were held constant.
The data in Figures 7 and 8 was taken from an elevator simulation of traditional elevator dispatching, i.e. not destination dispatching. This means that the elevator trajectories are defined pretty much by the car calls that are placed by passengers after they have entered the elevator. Once the car calls are entered, the elevator has little choice but to serve each car call in turn.
The differences in the trajectories shown in Figures 7 and 8 are due to the minimal change to the traffic list of a single passenger showing up 30 seconds later. Car 2 has a passenger traveling to floor 10 on its first trip from the lobby in the Figure 7 scenario, but does not have that same passenger in the Figure 8 scenario. This is because the passenger in question has been delayed by 30 seconds in Figure 8. As a result of the change in passenger demand, car 2 gets back to the lobby faster in Figure 8 than in Figure 7 since it does not have to travel to floor 10. Once car 2 arrives at the lobby it picks up the passengers waiting there, and the set of passengers that will enter each car from this time on has changed between Figures 7 and 8. This, in turn, changes the elevator trajectories and affects the performance metrics.
This small change in passenger arrival represents a significant change in the average wait time, though. In the first scenario the AWT is 21.9 seconds and in the second scenario it is 34.6 seconds. Despite the fact that these two simulations both used the same traffic pattern, the small change in the traffic list led to a big difference in the AWT.
A review of the first scenario, Figure 7, which has the shorter average waiting time, shows that the two elevators tend to alternate their lobby arrival and departure. In comparison, in Figure 8 the two elevators are tending to arrive and depart the lobby at the same time. When elevators are traveling together and arriving at and leaving the lobby at almost the same time it means that the waiting passengers in the lobby may have to wait longer to get into an elevator. When the elevators are synchronized such that they are arriving at the lobby at different times it is likely that the time between elevator arrivals at the lobby is shorter and, therefore, passengers in the lobby do not wait as long to get into an elevator. In this case, the later arrival of a single passenger has affected the synchronization of the elevators enough to seriously impact the average wait time.
5.2 Multiple Traffic List Simulation Results
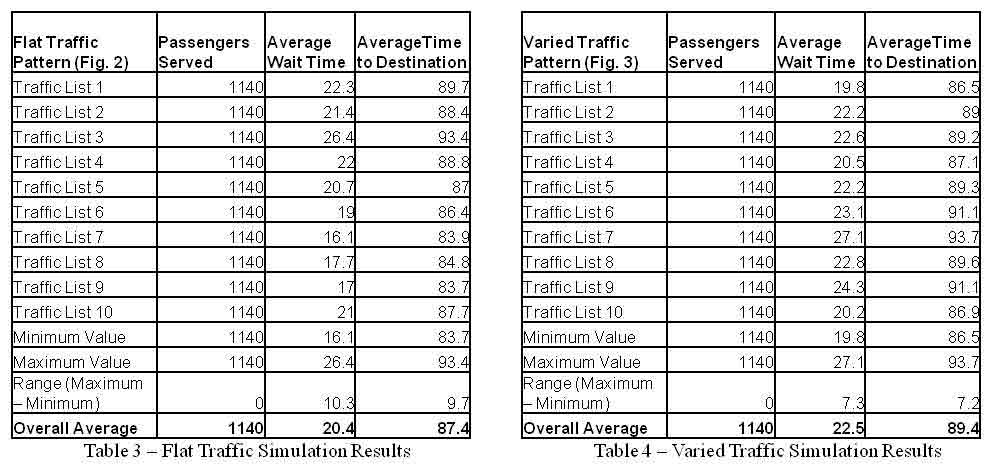
Tables 3 and 4 show results from multiple traffic lists derived from the same traffic pattern. The reader can observe that the average wait time (AWT) and the average time to destination (ATTD) may vary significantly based on the traffic list and can conclude that it would not be wise to categorize the results for a specific traffic pattern based on a single traffic list simulation. Table 3 gives the results for each of ten traffic lists based on the flat traffic pattern shown in Figure 2 as well as the minimum, maximum and average value for each metric. Table 4 gives the same type of data for traffic lists based on the varied traffic pattern shown in Figure 3.
The range of values, shown in Tables 3 and 4, illustrates the danger of relying solely on a single traffic list. Consider the AWT for the flat traffic pattern (Table 3). There is one traffic list that results in an AWT of 26.4 seconds and there is another list that results in an AWT of 16.1 seconds. The range between these two values is 10.3 seconds. The average value over the 10 runs is 20.4 seconds. If it is assumed that 20.4 is close to the “true” AWT value then reliance on either of these single runs might mean that the simulation is understating the AWT by approximately 21% or overstating the AWT by almost 30%.
Table 2 gives the performance results of one traffic list based on the flat traffic pattern and one traffic list based on the varied pattern. In this case, the flat traffic pattern list resulted in an AWT of 22.3 and an ATTD of 89.7, and the varied traffic pattern had an AWT of 19.8 and an ATTD of 86.5. Based on Table 2, the elevator performance is better with a varied traffic pattern. A review of Tables 3 and 4, however, for each of which 10 traffic lists were simulated and averaged, indicates the opposite. After averaging 10 traffic list simulations for each pattern the flat pattern has an overall average AWT of 20.4 and an overall average ATTD of 87.4 while the varied pattern did not perform as well with an overall average AWT of 22.5 and an overall average ATTD of 89.4. The data presented supports the premise that it is risky to evaluate simulation studies based solely on a single traffic list.
6. CONCLUSIONS
With the increasing use of elevator simulation to evaluate the performance of proposed and existing elevator systems it is critical that the elevator industry recognize that elevator simulation results are not totally analogous to traditional handling capacity metrics. This paper discusses simulation variance that is not automatically “averaged out” as it is in traditional formulas; further work could be done in defining what “handling capacity” might mean in the simulation environment. The difference between steady-state handling capacity and peak handling capacity, for example, could be examined.
Elevator simulations can give very accurate depictions of very specific scenarios. Although increased fidelity, as compared to historical probability formulas, can be very useful, it is also more complex and must be treated as such. In particular, the ability of elevator simulators to directly model slight variations in traffic scenarios also means that failure to take into account the variation effects may lead to misleading or incorrect conclusions.
It is recommended that elevator simulation requests be accompanied by specific details regarding the desired traffic pattern to be evaluated and that all simulation results are reported with a description of the underlying traffic pattern(s) used. Ideally, some method of adjusting for potential variance, such as reporting data averages from multiple executions of traffic lists from the same underlying pattern, should be used when reporting simulation results.
All elevator professionals who use elevator performance simulations should be aware of the significant effect that variances in traffic assumptions may have on simulation results. Similarly, it should be recognized that day to day variances in elevator traffic or traffic pattern shifts over time will cause changes in elevator performance in the building just as variation in traffic inputs will cause changes in simulation results.
REFERENCES
Barney, G.C. and dos Santos, S.M. (1985). Elevator Traffic Analysis Design and Control Revised Second Edition. Peter Peregrinus Ltd., London. 386pp.
Barney, Dr. Gina (2010). Traffic planning and selection of lift equipment and performance In: Transportation systems in buildings CIBSE Guide D: 2010, Ken Butcher (Ed). The Chartered Institution of Building Services Engineers, London, pp.3-1:3-20
Peters, Dr. Richard (2010). Advanced planning techniques and computer programs In: Transportation systems in buildings CIBSE Guide D: 2010, Ken Butcher (Ed). The Char-tered Institution of Building Services Engineers, London, pp.4-1:4-14
Strakosch, George R. (1967). Vertical Transportation: Elevators and Escalators. John Wiley & Sons, Inc., New York. 365 pp.
Get more of Elevator World. Sign up for our free e-newsletter.
