Computational Environment for Simulating Impact of Building Sway on High Rise Lifts
Apr 1, 2022

by Jaakko Kalliomäki, Jarkko Saloranta, Joonas Sorvari, Sakari Mäntylä, Mikko Puranen

This paper was first presented virtually at the 12th Lift & Escalator Technologies Symposium in September 2021 and printed at the symposium website at liftsymposium.org.
Keywords: High-rise Lift, Sway, Traffic, Simulation
Abstract
In high-wind conditions, tall buildings are subjected to sway, which creates a challenge in maintaining passenger comfort and safety. The lift performance may need to be reduced or the lift service may even need to be suspended in severe conditions; however, since lifts are a key service of a building, any reduction in their performance may cause substantial loss of revenue. Therefore, there is a strong demand on the one hand to maximize lift service availability as long as it is safe, and on the other hand, to demonstrate the impact of sway countermeasures on the performance of the lift system in advance. This article explains how a computational environment that models a lift system in building sway conditions is built based on a segmented approach. The first part consists of the main lift model, which utilizes the building and lift data and is able to run the lift, based on recorded or simulated lift calls. It also implements the operational mode it receives from the real-time rope sway calculator. This model forms the second part of the environment, and it calculates rope amplitudes based on recorded or simulated building motion and car position from the main model and determines the appropriate operational model. The third part consists of the rope sway analysis tool, which provides precalculated amplification data for the real-time calculation model, the full-scale rope sway simulation tool, which acts as a reference for result validation, and the building motion calculator. All simulations are based on the modeling of physical events. This environment can be used to predict lift system performance on future buildings and to test the efficiency of different sway control strategies, and the visualization of results allows effective communication between different parties in high-rise building projects.
1. Introduction
The trend of building taller has been combined with a trend of creating super-slender buildings. This later trend is driven by high city-center land value, its scarce availability, development in engineering techniques and aesthetic trends.[1] The trend for tall and slender buildings creates unique challenges in maintaining a good lift service while also preserving high passenger comfort and safety. The problem is particularly challenging because it involves multiple disciplines, e.g., mechanical, electrical and control system design of the lift, lift traffic planning, wind engineering and building structural engineering.
Robert S. Caporale described in his dissertation in 2000 the challenges of traditional approaches by lift engineers to tackle rope sway;[2] either the rope sway in lift ropes is dampened by hardware, or the speed of the lifts is reduced by software. The drawback of the hardware solution is that effective dampening of suspension and compensation ropes on both the car and counterweight side requires complex arrangements, which are costly to produce, install and maintain. The speed reduction by software, and ultimately the cessation of lift service in severe conditions, can lead to loss of revenue and make areas of the building less desirable and less valuable to building owners. In conclusion, Caporale anticipated that the hardware dampening strategy would become the preferred option, but the experience of the authors suggests that software solutions have become the industry standard.
Since then, different ways of simulating the dynamic response of high-rise lift systems have been published, e.g., by Rafael Sánchez Crespo, et al.,[3] and the work to reduce the impacts of the software-based solution has continued to this day. For instance, an approach which aims to optimize passenger ride comfort, traffic and building and rope sway has been presented,[4] as well as an approach where rope sway is estimated in real-time based on car location to minimize impact on lift system performance.[5] But a way is needed to test and demonstrate the effectiveness of different sway control strategies and to help the communication of experts in different fields.
This paper describes how a computational environment is built from segments to achieve these targets. Building motion data can be reproduced using a mathematical model, and rope amplification data is generated based on the physical properties of the ropes, the lift system and the building. The lift and building properties are also used to populate lift running information. The rope sway amplitudes are then calculated based on these variables. As a final step, the processed data can be exported into various output formats.
While different aspects of this computational environment have been studied elsewhere, combining the different elements is what provides the means to simulate different kinds of configuration changes quickly and to visually assess their impact on the performance of the lift system. The accuracy of the simulation may also be improved by substituting some of the computational elements with actual recorded data, if such information is available.
2. The Computational Environment
The computational environment is a context that combines several calculation elements together and enables the creation of visualizations that illustrate the impact of changes of input parameters or boundary conditions.
2.1 Dynamically Changing Lift Operation
One of the main reasons why a new computational environment was built was the fact that the lift operation changes dynamically based on building motion, calculated rope sway and selected operation mode. For instance, decreasing lift speed is one common way to alleviate rope sway problems, and the decision of reducing lift speed can be made based on calculated rope amplitudes. The speed reduction, in turn, affects the sequence of calls that can be served and, subsequently, how the rope sway evolves.
Furthermore, even if there were different kinds of tools available for assessing lift traffic, the traffic analysis focuses traditionally on peak traffic and on the handling capacity of the lifts.[6] Therefore, these tools are targeted for estimating the required speed and quantity of the lifts in normal operational mode and are, as such, unsuitable for simulating the lift operation in building sway conditions. Also, traffic analysis normally ignores service lifts. Service lifts are more likely to serve the floors where rope resonance is present, and may be assigned as firefighting and evacuation lifts, in which case basic safety must be ensured even in extreme sway conditions.
2.2 Structure of the Environment
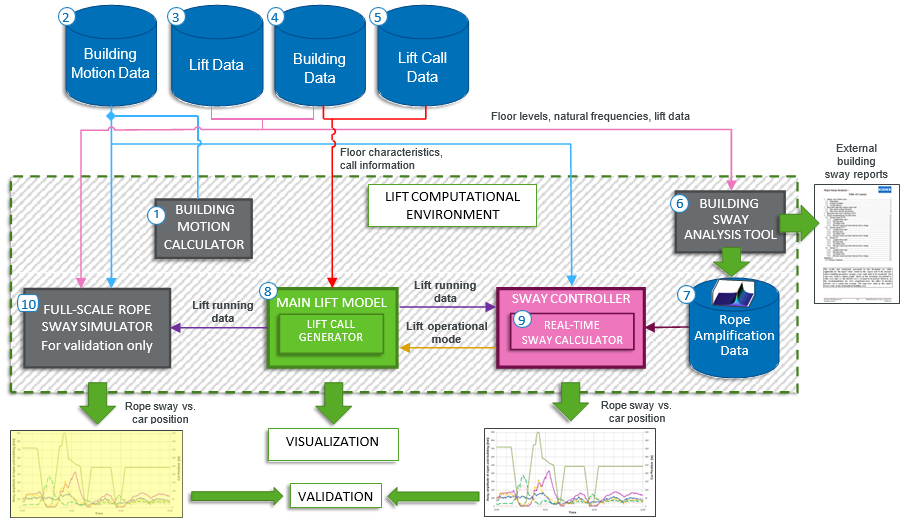
The structure of the computational environment is presented in Figure 1. The inputs for the computational sway environment are the Building Motion Data (2), which consist of acceleration and amplitude levels of the building; Lift Data (3), which consists of masses and lengths of lift components; Building Data (4), which consist of building characteristics, such as natural frequencies and information, such as quantity and positions of served floors; and Lift Call Data (5), which is a log of calls assigned to the lift. Alternatively, building motion can be artificially populated using a Building Motion Calculator (1) and the call data using a Main Lift Model (8) within the computational environment.
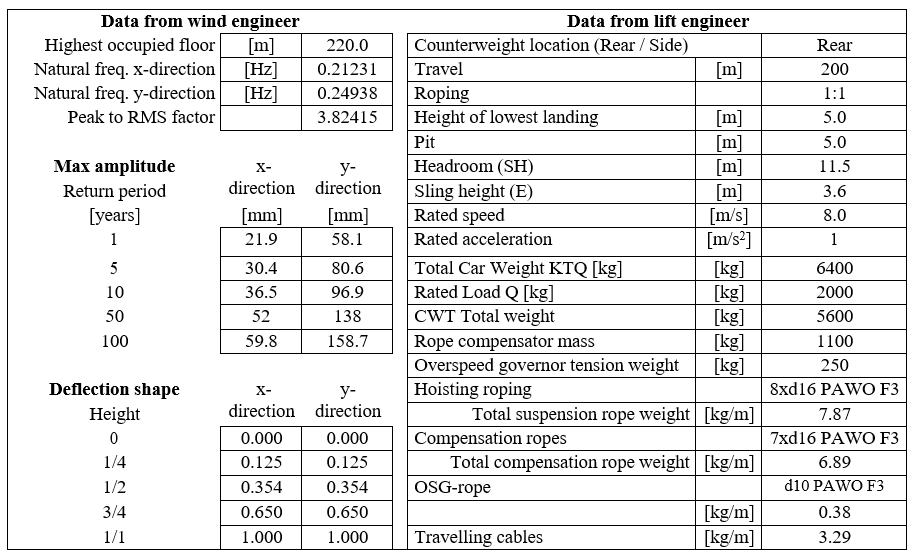
The Building Motion Data and Building Data are typically received from the builder’s wind engineering consultant. Preliminary lift data is received from the lift engineering team. A simplified summary of these data sets is shown in Table 1. Lift call data can be extracted from a lift monitoring system, such as KONE E-Link.
The lift data, floor information and natural frequencies of the building are fed to the Building Sway Analysis Tool (6), which generates the Rope Amplification Data (7) needed by the Real-Time Sway Calculator (9).
The Main Model (8) is in charge of the lift operation. It utilizes the Building (4) and Call Data (5) to calculate the Lift Running Data (i.e., speed and position of the lift). The Main Model feeds the Lift Running Data to the Real-Time Sway Calculator (9), which returns the lift operational mode according to the predefined sway amplitude thresholds. The Main Model changes the operational mode at the next possible time step and feeds the new speed and position information back to the Real-Time Sway Calculator, consequently starting the loop again.
The log of lift running data can also be sent to the Full-Scale Rope Sway Simulator (10) for validation. In theory, the full rope sway simulator provides exactly the same information as the computational environment depicted above, but it requires a lot of processor capacity. The computational environment has been optimized for performance, thus offering a possibility to carry out extensive simulations in a reasonable amount of time.
3. Elements of the Computational Environment
3.1 Main Model and Lift Call Generator
The purpose of the main lift model is to replicate the functions of the actual lift controller. It controls the acceleration and the target speed of the lift, assigns different drive profiles and calculates the position of the car at each time step. Furthermore, the main model is the entity responsible for implementing the operational modes — as requested by the sway controller — at the next possible time step according to their priority. For example, the lift controller can actuate the lift parking mode only after it has finished serving the current call.
The main model simulates the running of the lift by utilizing the floor characteristics (type and position) of the building and the stored lift-call data, which can be either actual data from an existing building or data for a future building generated by a traffic simulation software. Alternatively, the lift call generator within the main model can populate random calls based on given probability distribution (e.g., half of the calls to or from the main floor), or call data from a previous simulation can be reutilized for comparison purposes.
Based on the lift calls, the main model calculates car speed and position, which are governed by the rated acceleration and the applicable operational mode of the lift. Other parameters, such as loading time to calculate the total waiting time between calls, are also utilized. The time step length for car position calculation has to be shorter by an order of magnitude compared to the real-time sway calculation.
3.2 Sway Controller Model and Real-Time Sway Calculator
The sway controller model collects the needed inputs (e.g., building acceleration, car position), determines the suitable operational mode and maintains the timers, which define how long a given mode must be maintained. The objective of the lift operational mode selection is to maximize the service rate without sacrificing ride comfort or safety of the passengers. The correlation between speed profile selection and ride comfort has been demonstrated earlier by Roivainen et al.,[4] and here the focus is to limit the rope amplitudes without quantifying the lateral vibrations in the car in order to maintain high performance level.
3.2.1 Operational Modes
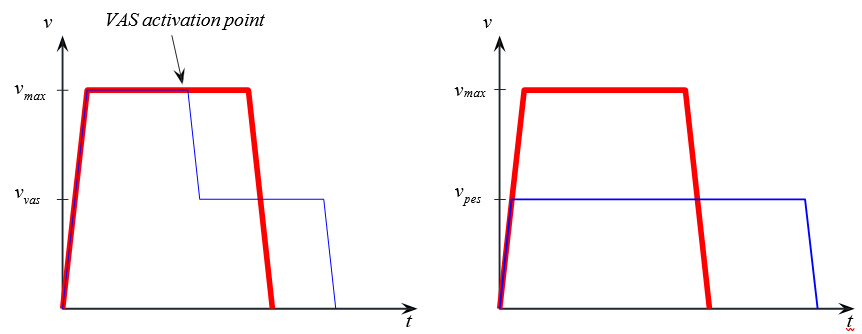
At each given time, the sway controller determines the most suitable operational mode to the lift. The basic operational mode alternatives, in a prioritized order from lowest to highest, are normal, variable speed (VAS), performance selection (PES) and park (PARK). VAS drive profile assigns reduced speed to the top or bottom part of the shaft. PES profile adjusts the maximum driving speed to a lower level for a set period of time. PARK parks the car to a pre-defined park position for a set period of time. Only one mode can be active at a time. VAS and PES drive profiles are illustrated in Figure 2.
3.2.2 Real-Time Rope Sway Calculation
The real-time rope sway calculation occurs within the sway controller model. Rope amplitudes are estimated using lift car position information, building acceleration amplitudes and rope-specific data tables for each period of building acceleration. The method has been inspired by the paper by Arai, et al.[5]
The advantage of calculating rope amplitudes based on predefined tables is that the calculation is light and fast. This means that in actual lift installation, this kind of calculation can be executed by a lift group controller in real-time without overburdening its resources, while taking into consideration that the calculation has to be done for both primary building modes (x- and y- directions) and for each lift separately. In the case of simulation, the efficient calculation makes it possible to calculate long periods in a short amount of time.
3.2.3 Building Acceleration Amplitudes
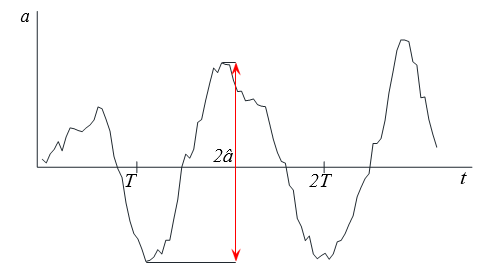
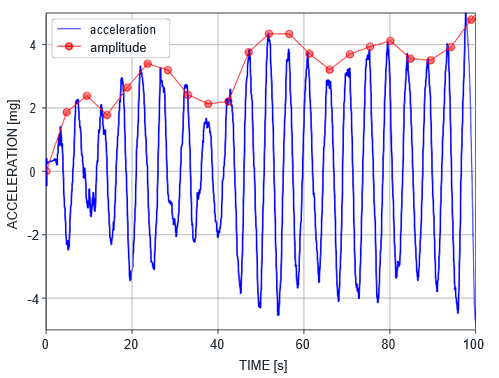
Building acceleration amplitudes are determined from periodic acceleration data. The effective amplitude â is calculated from the peak-to-peak amplitude. That is, the effective amplitude â is defined as half the difference between the highest and the lowest value in the acceleration period. See Figure 3 and Figure 4.
3.2.4 Rope Amplification Table
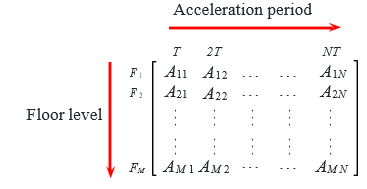
Rope amplification table is a two-dimensional array, denoted hereafter as A, where each row represents a floor level and each column an acceleration period; see Figure 5 for illustration. Table values are precalculated by solving a second-order damped wave equation with constant acceleration amplitude. When the rope tension is assumed to not change due to rope displacement, the resulting equation is linear. Thus, the rope amplitudes u are directly proportional to acceleration amplitude, i.e., u~âA. Consequently, once the table has been generated for a single acceleration amplitude, it can be used for any acceleration amplitude by employing scaling. Table cell value Aij is the amplification factor in the considered rope after j acceleration periods when the lift car is at rest at the ith floor level.
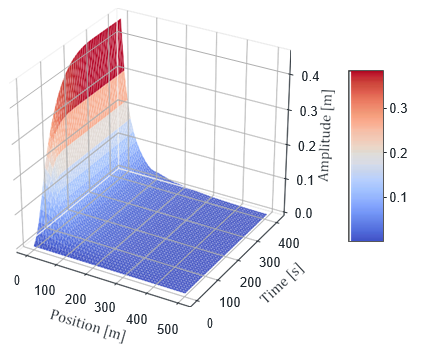
Hereafter, it is assumed that the rope amplification data tables are generated using unit acceleration amplitude. It should be noted that calculation floor levels do not need to coincide with car landing levels. A data table is visualized in Figure 6.
Rope amplitudes are updated at discrete time steps t0, t1, t2, . . . such that tn−tn−1=T. Suppose that at time tn the nearest floor to the lift car, in direction of travel, is the ith floor. Furthermore, let â(tn)Aij be the amplitude value in row i which is closest to previously calculated amplitude u(tn−1). Then amplitude at time tn is calculated as

where the amplitude increment is given by

where â(tn) is the acceleration amplitude of the nth acceleration period. However, if the previous amplitude is higher or equal to the maximum table value in row i, the amplitude decays exponentially or stays the same:

where pi is the precalculated ratio between building period and rope period when car is at the floor position Fi and ![]() is the damping ratio value.
is the damping ratio value.
3.3 Building Motion Time-Series Calculator
The time series data for building motion is calculated by the means of a narrow-band process[7],[8] shown in Figure 7. The building motion w0(t) is calculated from Gaussian white noise ξ(t) by a two-step filter. The filter consists of a low-pass filter and a band-pass filter.
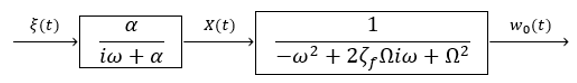
The filter parameters are chosen such that the building motion w0(t) has the desired statistical properties. The filter parameter α is calculated as
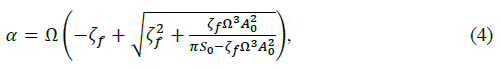
where Ω is equivalent to the building natural frequency and corresponds to band-pass filter center frequency, ζf is the band width of the band-pass filter, A0 is the amplitude of a harmonic sinusoidal time series that has the same RMS value as the building motion w0(t) and S0 is the constant level of the power spectrum of white noise ξ(t).
The building motion time-series is created with pre-defined RMS value, peak-to-RMS ratio and building natural frequency. The value for peak-to-RMS ratio is estimated as[9]
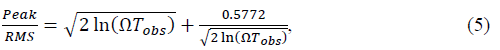
where Tobs corresponds to observation time period, typically 600 s or 3,600 s in wind engineering practice. It should be noted that obtaining a pre-defined value of peak-to-RMS ratio for building motion w0(t) time series is not guaranteed by the narrow-band process described above. However, it can be easily obtained for typical peak-to-RMS values by running the process with new random Gaussian white noise ξ(t) time-series until the desired value is obtained.
3.4 Full-Scale Simulation Model
The full-scale model is based on second-order damped wave-equation, and the governing PDE-equation is solved numerically by the means of finite-difference method. The simulation model used in the computational environment is a KONE in-house developed code. A very similar approach to solve the rope sway for a moving lift system with finite-difference method has been presented.[10] In the full-scale model, more complex events can be easily considered, e.g., ropes hitting shaft equipment or a shaft wall, or the application of the hardware solutions mentioned in Chapter 1.
The full-scale model is a collection of scripts, which offers a high degree of freedom but also requires an experienced user with in-depth knowledge of the problem that is being studied. In the case of the computational environment under discussion, the full-scale model is used as a reference model to make sure that the rope amplitude calculation logic using the amplification data tables is producing accurate results.
3.5 Rope Amplification Data Table Calculation
Rope amplification data tables described in Chapter 3.2 are generated using the rope sway analysis tool. This tool applies the same finite difference approach as the full-scale model, but it uses a dedicated input file and runs only limited scripts to produce specific output files. This tool is also used to generate calculation results for external rope sway analysis reports.
In the beginning of the simulation, the rope displacement is set to zero, and the building starts to sway with given period T and with unit acceleration amplitude of 1 mg. The unit acceleration amplitude of the building is set to building height, where the lift specific building accelerometer is located, i.e., typically the machine room height. The lift car remains stationary at given shaft location Fi during one simulation run. The maximum absolute displacements of the different rope segments are recorded as a function of time and stored with building period T interval as a row in the corresponding rope amplification data tables. When the above-mentioned simulation is repeated for all lift car positions Fi for the studied lift, the rope amplification data tables are obtained. The simulation time for each lift car location Fi needs to be long enough so that converged maximum amplitudes are found for each rope segment.
4. Outputs
The computational environment can be configured to generate various outputs. This chapter presents the three basic outputs and their usages.
4.1 Model Comparison
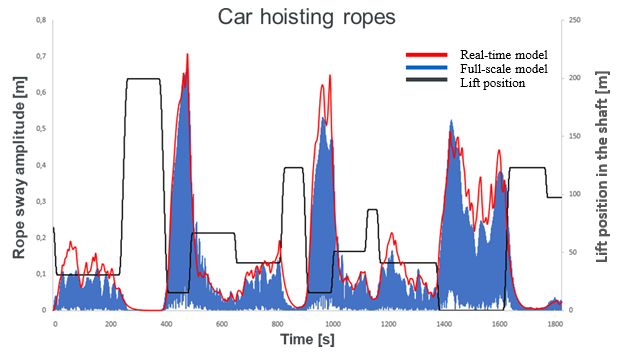
For validation purposes, the Lift Running Data, Building Data and Building Motion Data can be fed to the full-scale rope simulator, which calculates the “accurate” amplitudes that can then be compared to the “estimated” results provided by the Real-Time Sway Calculator. Figure 8 shows the results of one of such validations. As noted, it is possible to achieve good correlation between the results based on the predefined tables (Real-time model) and the finite-difference method (Full-scale model).
4.2 Numerical Data for Analysis
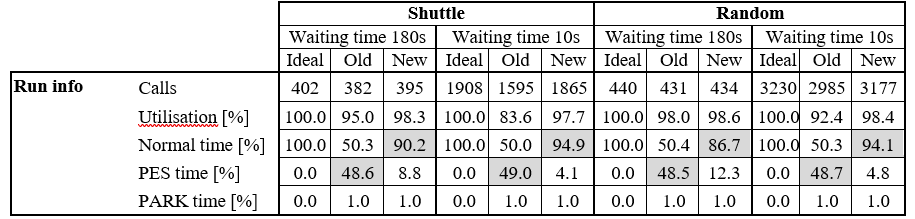
The numerical data produced by the computational environment is demonstrated using a sample lift with a travel of 200 m, a rated speed of 8 m/s and with 34 landings. The minimum times the lift spends in PES or PARK are 10 and 15 min correspondingly. Two scenarios were analyzed: one where the lift is running as a shuttle service between the lowest and the highest floor, and the other where there are also intermediate floors and the lift serves random calls. Both scenarios are further assessed with the assumption that the total waiting time is 180 s or 10 s at the landings where the lift stops. The results are presented with three conditions: “Ideal” represents the situation where no sway control features are present; “Old” represents the situation where sway control is based on building acceleration only; and “New” represent the situation where sway control is based on real-time rope amplitude calculation. The results are presented in Table 2.
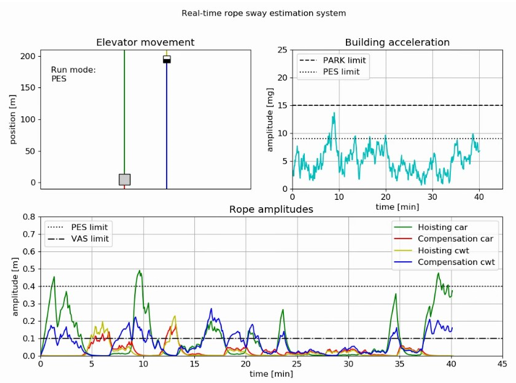
4.3 Animation
The main model can directly create animations to visualize the numerical data from the computational environment. Figure 9 shows a simple and effective way to demonstrate the correlation between different aspects of the rope sway problem. The upper left corner shows the relative position of the car and counterweight at each time step, the upper right corner shows the building acceleration and the bottom part shows the calculated rope amplitudes of each rope segment.
5. Discussion
In his dissertation, Caporale predicted that mechanical countermeasures would prevail over software solutions because the customers would outweigh the higher initial expense over the reduction in lift system performance. Based on the experience of the authors, the development has not proceeded as Caporale anticipated. There are a number of reasons for this — the most obvious being the quick advancements in software-based control systems. In addition, the advancements in building technology have made buildings less sensitive to sway. One of the less apparent reasons has been the lack of tools that could be used to easily demonstrate the effectiveness of different sway control strategies — whether software or hardware based — to the customer. This deficiency has left customers without proper justification in making the decision between short-term investment cost and long-term profitability.
The introduction of the computational environment for simulating the impact of building sway on high-rise lifts eliminates this short-coming and gives the customers the possibility to make educated decisions. The visualization of results also allows effective communication between different parties in high-rise building projects who may not have in-depth knowledge of the intricacies of lift engineering. For lift engineers, the computational environment enables the testing and refining of different sway control strategies in different kinds of buildings and in varying weather conditions.
These types of tools are needed to answer the ever-tightening expectations of the super tall and super slender buildings.
Also read: Rope-Sway Control for High Rises
References
[1] S. Marcus, “The New Supers: Super-Slender Towers of New York,” Chicago, 2015.
[2] R. S. Caporale, “The Effect of Building Sway on Lift Ropes and Cables,” in Vertical Transportation Review, Elevator World Inc.
[3] R. S. Crespo, S. Kaczmarczyk, P. Picton, H. Su and M. Jetter, “Modeling and simulation of a high-rise elevator system to predict the dynamic interactions between its components,” in Symposium on Lift and Escalator Technologies, Northampton, 2013.
[4] G. Roivainen, J. Saloranta, M. Ruokokoski, J. Kalliomäki and V. Sreenath, “Transient Dynamic Computation for Mega-High Rise Lifts,” Northampton, 2018.
[5] Y. Arai, K. Tanaka, J. Koizumi and S. Sasaki, “Application of Seismic Design to Elevators for Skyscrapers,” in Elevator Technology 22, Proceedings of Elevcon 2018, 22nd International Congress on Vertical Transportation Technologies, Berlin, The International Association of Elevator Engineers, 2018.
[6] G. S. Strakosch and R. S. Caporale, The Vertical Transportation Handbook, 4th Edition, New York: John Wiley & Sons, Inc., 2010.
[7] J. W. Larsen, R. Iwankiewicz and S. K. R. Nielsen, “Nonlinear stochastic stability analysis of wind turbine wings by Monte Carlo simulations,” Probabilistic Eng. Mech. 22, 181-193., 2007.
[8] S. Kaczmarczyk, R. Iwankiewicz and Y. Terumichi, “The dynamic behaviour of a non- stationary elevator compensating rope system under harmonic and stochastic excitations,” Journal of Physics: Conference Series 181, 2009.
[9] A. G. Davenport, “Note on the distribution of the largest value of a random function with application to gust loading.,” Proceedings, Institution of Civil Engineering, 28(2):187-196, 1964.
[10] H. Kimura, H. Ito and T. Nakagawa, “Vibration Analysis of Elevator Rope – Forced Vibration of Rope with Time-Varying Length,” Journal of Environment and Engineering. Vol. 2, No 1, pp. 87-96, 2007.
[11] P. Andrew and S. Kaczmarcyk, Systems Engineering of Elevators, Mobile: Elevator World, Inc., 2011.
Get more of Elevator World. Sign up for our free e-newsletter.
![]()


![]()