Construction of Poincare Space Map and Phase Plan Map for Escalators with Mechanical Fault, Part 3
Dec 1, 2021

Your author constructs his maps for an escalator suffering from mechanical failure.
Abstract
In this study, we will construct the Phase plan map (Poincare section) and the Poincare space map for an escalator with a mechanical failure. They will be compared to another section and map that will be constructed for an escalator without a mechanical fault. The difference in the behavior of the two escalators was looked at before in one of our previous studies,[1] when we compared the fractal dimension values of an escalator with a failure to the one free of failure. The escalator with a mechanical failure recorded higher fractal dimension values compared to the escalator without a mechanical failure. In this study, we will qualify the difference between the two escalators by plotting the Poincare section and the Phase plan map (Poincare section) for measurements from the two escalators. This part of our continuous series in this subject is an attempt to examine whether the mentioned techniques can detect mechanical flaws in a machine like an escalator. Would the shape of plots for the data from the smart step give different patterns for the attractors of the measured variables? The study will try to answer that question.
Introduction
In Parts 1 and 2[2, 3], we tried to translate the behavior of a machine like an escalator, both with and without passenger loading, to qualifiable maps by plotting the phase plan map (Poincare section) and the Poincare space map. These studies have shown that the distribution and shapes for the bath of the attractors change when introducing the effect of passenger loading. This study will try to explore a similar exercise by comparing a healthy machine to a machine with a mechanical defect. Unfortunately, so far, we have failed to find any references for a similar work. However, we believe defining maps and layouts of attractors for variables can be an interesting, useful, fast and efficient tool in understanding the behaviors of mechanical machines like escalators.

Smart Step Measurements
As per Parts 1 and 2, the measured data from smart step in one of our previous studies[1] were used to conduct this study. The procedure of the obtained data is like what was already explained in Part 1.
Constructing the Map
In this study, the maps were constructed in a manner like that used in Part 1. Similar procedure of work and analysis was used here.
Results and Discussion


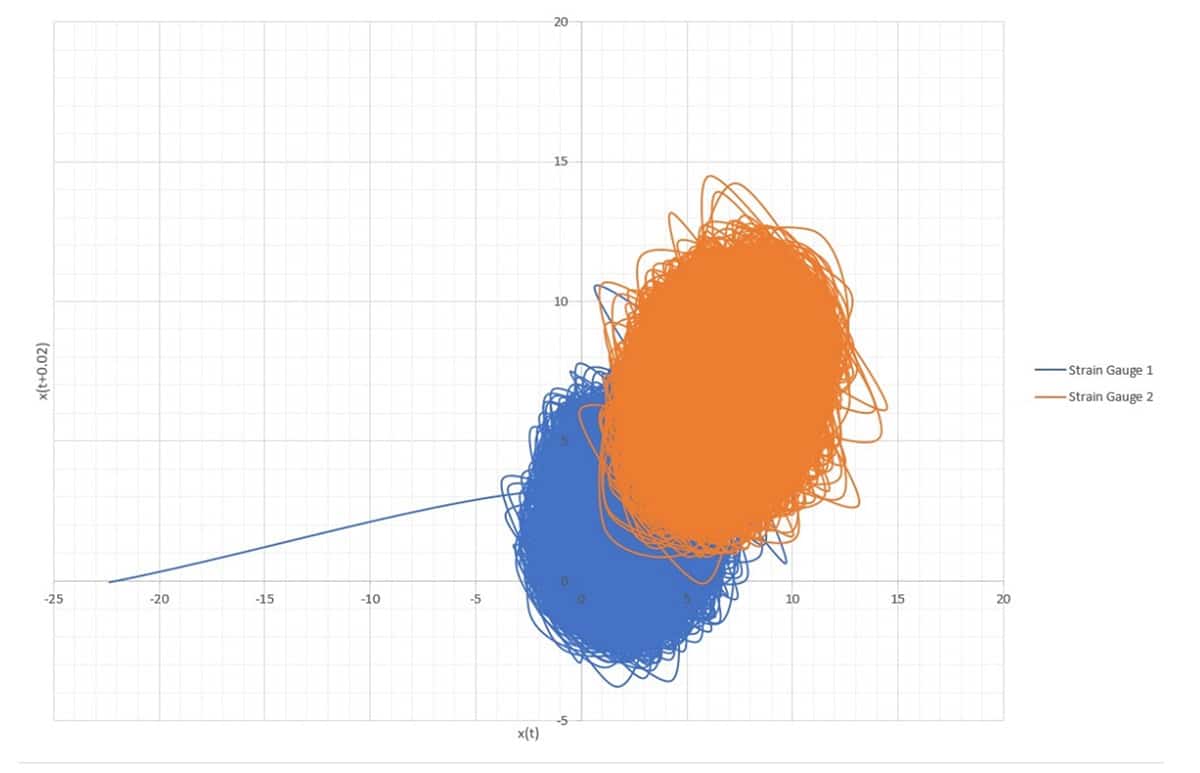
Figures 1 and 2 show the phase map and the Poincare map for the data of the two strain gauges in an escalator free of a mechanical fault. Figures 3 and 4 show the maps for an escalator with a mechanical fault. Comparing Figures 1 and 2 to Figures 3 and 4 shows that the loops of the attractors for strain gauges 1 and 2 accumulate in a small region on the scale for the escalator free of a mechanical fault, while the loops of the measured attractors for the escalator with a mechanical fault are stretched along a bigger scale.
Conclusions
This study has reconfirmed our previous findings that plotting the phase plan map (Poincare section) and the Poincare phase map can be useful tools in translating and understanding the behavior of a mechanical machine like an escalator. The attractors in the maps tend to accumulate in small loops; however, as soon as a mechanical fault develops in the escalator, the attractors start to stretch to bigger loop cycles along the running period for the attractors.
References
[1] A. Albadri, “Escalator Fractal Behavior (part 4),” to be published.
[2] A. Albadri, “Escalator Fractal Behavior (part 5),” to be published.
[3] Ali Albadri, “The construction of Poincare space map and phase plane map for escalators (part 1),” to be published.
[4] Ali Albadri, “The construction of Poincare space map and phase plane map for escalators (Part 2),” to be published.
Get more of Elevator World. Sign up for our free e-newsletter.


