Difficulties in Comparing the Results of Lift-Traffic-Simulations
Jan 1, 2014

Difficulties in Comparing the Results of Lift-Traffic-Simulations
by Hans M. Jappsen and Olaf Rieke
This paper was presented at  USA 2012, the International Congress on Vertical Transportation Technologies and first published in IAEE book Elevator Technology 19, edited by A. Lustig. It is a reprint with permission from the International Association of Elevator Engineers
  (website: www.elevcon.com). This paper is an exact reprint and has not been edited by ELEVATOR WORLD.
Key Words: Traffic Analysis, Destination Control, Simulation Software, Comparability of Simulation Results, Verification of Lift Performance, Evaluation.
Abstract
Destination Control Systems (DCS) have displaced Conventional Control Systems on new high rise lift installations. Software-based control algorithms play the main role in the DCS dispatching process. Driven by this circumstance, lift traffic analyses for DCS installations are generally carried out by simulations rather than by Round-Trip-Time (RTT) calculations.
Since lift designers and the lift industry use different simulation tools with different algorithms and different procedures, the simulation results are not comparable to each other. In addition to that, internationally agreed criteria to validate these results – as they do exist for the RTT method – are missing. A suitable tool to measure the promised control system performance on the job-site is not available.
1. Introduction
1.1 The Introduction of Destination Control Systems on the European Market
Jappsen Ingenieure (JI) was founded in 1972 and has been working as a lift consultant company, specialized for high rise buildings in Europe since then.
Until the mid-nineties JI had planned high-rise lifts solely with conventional control systems. In April 1989 JI was asked by Dr. Schröder, Schindler to pass an expert opinion about their new developed Destination Control System (DCS), resulting in the recommendation to develop further, to offer and to install DCS on selected future projects.
Eight years later, Schindler got the order to install their first commercial DCS on the JI project ‘Eurotheum’, a high-rise office building in Frankfurt, Germany. The building was commissioned in the year 2000. The lifts were designed for a conventional control system and the advantages of DCS were an extra benefit.
The installation of the first ThyssenKrupp DCS took place in the year 2000 in the scope of a JI lift refurbishment job for the building of the ‘Sparkassenversicherung Stuttgart’, Germany.
Our lift design for ‘Gallileo’ tower in Frankfurt started in 1997. Since there was not enough space for the number of lifts when equipped with conventional control system, Jappsen Ingenieure were forced to develop a lift strategy based on DCS (To our knowledge, Galileo is the first building worldwide, which was designed on the basis of a destination control system).
Since there was no simulation software available for us at that time, JI were forced to execute our calculations on the basis of a modified RTT method. The job was finally given to Kone and they installed their first commercial DCS in the year 2003.
Since Galileo, JI has designed lifts for high rise buildings solely with DCS, using simulationbased analysis tools and round trip time calculations.
Pushing forward the development of Destination Control Systems, JI meanwhile has 15 years of experience with DCS. Compared to lift layouts with conventional control, DCS allows handling capacity to improve by approximately 10 to 20 %. This means less lifts; saving space, cost and energy. Therefore, we judge the installation of lifts with conventional control systems for high rise lift groups a misplanning.
Note: When we talk about DCS, we always mean ‘Full DCS’, with DCS terminals on each landing and without the option to give car calls via a car operating panel.
1.2 Challenge
One of the most demanding and important business of our job is the development of efficient lift strategies for high-rise, high-quality office buildings.
Since cost efficiency is the main driver of a complex building design process, clients and project managers naturally challenge all cost/decision-relevant results – not only the ones of our findings. It is quite common to request a second and third opinion, in our case traffic analyses, provided by other consultants or lift manufacturers.
We often make the experience that simulation results supplied by others vary significantly from our results, with the consequence that our proposed lift strategy – wrongly – seems to be under-elevated. However, we think that most of the buildings with DCS-lifts are overelevated. This is a confusing, non-acceptable situation – not only for our clients.
Lift Companies and simulation program suppliers sometimes are very innovative, not only related to their products, but also in their marketing. In order to merchandise new control systems or simulation programs, they often create their own ‘lift-simulation-world’ with a muddle of simulation procedures, traffic patterns, new definitions and benchmark criteria. The output of a traffic analysis report often is a variety of inconsistent, non-understandable terms, tables and diagrams. It somehow looks like a camouflage tactic in order to prevent a fair comparison between the products.
In order to mitigate this drawback JI has developed a ‘Lift Simulation Data Sheet’ (Appendix A), based on the findings during the preparation of the last Elevcon Workshop 2010, and included it in recent tender specifications. Bidders are forced to run simulations with predefined simulation procedures, lift-layout and passenger-data (arrival rates, simulation duration, traffic mix, number of landings, passengers per floor, rated load, max load, speed, travel height, passenger transfer times, photocell delay, advanced door opening, acceleration, jerk, door-times, start-delay etc.). The results shall be seen as one part of the offered technique.
In either case the bidder has to evaluate his one simulation results with excellent, good or fair.
2. Simulation
2.1 Why Simulation?
In the past, lift traffic analyses were executed with round trip time calculations. Up to now, there is no accepted modified round trip time calculation for destination control systems. So we have to use simulations. Round trip time calculation is a worst case consideration. Simulation could be used as a worst case consideration too.
We use simulations for different situations:
- For future buildings to design the lifts
- For existing buildings to show the consequences for the lift service, when parts of the building or of the lifts will be changed
Subsequently, we talk only about lifts for future office buildings.
2.2 Simulation Results
When we have designed the lifts for a future building, the investor usually asks someone to check it. The results will significantly differ from ours. Simulation results are not comparable.
To make simulation results somehow comparable, following conditions must be fulfilled:
- The same simulation software has to be used
- The simulation software must remain unchanged (as the round trip time calculation was unchanged)
- The simulation input data have to be revealed
- The used template has always to be the same
- The results have to be reproducible
Only if named conditions are fulfilled, we can talk about benchmarks.
We also know that the lift companies have to use their own software and we hope their simulation software is identical to the software used in the finally installed control system. The latter has to be improved continually by the lift companies and as a consequence, these companies have to use their own benchmarks. Finally, they have to rate the lifts being excellent, good, sufficient or poor. This classification everybody can understand.
Different simulation software have different algorithms, which will always remain a black box. Even if the conditions named above are fulfilled, the simulation results will be different. We only trust in our own simulation results.
2.3 Simulation method
JI use a template with a constant simulation arrival rate for 20 hours. If necessary, JI run simulations for different simulation arrival rates to show the influence of the traffic intensity on waiting times etc. We know that a round trip of a high rise lift takes about 3 minutes; in 20 hours we have approximately 400 round trips, in 2 hours 40 round trips, in 15 minutes 5 round trips and in 5 minutes less than 2 round trips.
During Elevcon 2010 Dr Finschi gave a presentation on ‘State-of-the-Art-Traffic Analyses’. He proposed a stepwise simulation with constant arrival rates. The simulation duration for each step should last at least 2 hours. The first 15 minutes and the last 5 minutes should be excluded in evaluation to reduce the influence of start- and end transients (see also Siikonen 2009).
We agree to the reported arguments, but in order to reduce the inaccuracy of the results, we prefer longer simulation times. We need a good accuracy to compare different car loads, speeds, door times etc.
Excursion: Simulations are not reality or Why not use ‘Design Templates’?
Modern Lift Monitoring Systems offer real lift traffic recordings. The output can be a Day-Traffic-Profile for a special day with up, down and interfloor traffic, which is normalized to the observed population per 5 minutes.
The profiles are like a fingerprint of an individual building. The recorded curves depend on several factors, like occupation density, people’s behaviour, restaurant location and operating hours, conference and smoker facilities, entrance levels, linking to public transport etc. and will be subject to significant changes during the lifetime of the building.
The conclusion that such a template, even if derived from several surveys, should be adopted as a design tool in lift simulations, is, in our opinion, incorrect. Simulations mislead to believe that they are close to reality, but the reality of a future building with a life time of at least 50 years is unknown.
A day traffic profile only represents a snap-shot of the real life in an existing building for a specific situation. It can be utilized as a template to evaluate the influence of a software update or a new control system for a modernisation of that specific building. Also it can be used to learn about people’s behaviour in modern buildings and thus being a tool to reflect the correct evaluation methods and benchmarks.
2.4 Handling Capacity
In our experience, a simulated up-peak handling capacity of 12 % of the designed building occupation is sufficient for single and multi-tenant office buildings resulting in good lift service. RTT-calculated we need 15 %. Our experience is that 12 % HC5 simulated is nearly equal with 15 % HC5 (RTT-) calculated.
General changes in office live, improvements of lift control systems in the last 30 years and the experience with modern lifts in modern office buildings gave the possibility to adjust the benchmarks for lift traffic analyses results. Required up-peak handling capacities dropped down from some 25 % to 12 % nowadays. Still, the development of Destination Control Systems bears some potential for performance improvement in the future.
2.5 Up-peak traffic
Before simulation based traffic analysis tools were established, Round Trip Time (RTT) calculation had been the accepted and reliable method to determine the correct number and technical features of lifts for a building. RTT calculations are a worst-case scenario approach.
During the recent years, lifts (with effective conventional control system) for office buildings were judged being sufficiently designed for all traffic conditions, if they could handle (pure) up-peak traffic based on a 15% Handling Capacity.
The reason for this was not that up-peak traffic has been the most demanding traffic, but that the theoretic basics have been generally accepted and the method has been verified by a huge number of buildings around the world. Thus lift designers – and their clients – were able to interpret results correctly due to long-term practice and experience. In order to benefit from this experience, we assume it to be a plausible argument to investigate the same basic traffic type by simulations. Basic traffic in this case means there is no split between incoming, outgoing and interfloor traffic. Multiple entrance levels, park decks etc. shall be considered.
JI think, that lifts designed for DCS and 12% up-peak Handling Capacity in 5 minutes are also sufficient for lunchtime peaks. Up peak traffic should be designed as 100 % up peak.
Excursion: Lunchtime
Often the argument arises that DCS improves up-peak traffic dramatically and a layout basedon the up-peak performance may not work for lunchtime.
For the fact that traffic surveys show lunch traffic being the most demanding traffic in modernoffice buildings and in order to figure out the behaviour / capabilities of the DCS algorithms,sometimes a closer look on it is required.
Lunchtime investigations do consider influences of restaurant locations and other facilities. Rather than with up-peak now the mix of the three traffic types incoming, outgoing andinterfloor is taken into account.
However, there is a disagreement under experts in which tranches the traffic should be splitand what the required Handling capacity should be. The range is from 45% incoming / 45%outgoing / 10% interfloor for multi-tenant office buildings at 10% simulation arrival rate up to 40% incoming / 40% outgoing / 20% interfloor for single-tenant office buildings at 12% simulation arrival rate.
Since we don’t know whether the future building will be occupied by one or by a lot of different tenants, we design lifts for the worse case of both: for single tenants at 12% simulation arrival rate.
When it comes to a validation of the results, lunch traffic must not be overestimated. Our experience is that any layout based on up-peak investigation is not challenged by poor lunchtime results. No client ever demanded an addtional lift to cope with high AWTs during lunch. The arguments are quite obvious: People are more relaxed during lunchtime and accept longer waiting times and denser car loads when travelling with their colleagues. The results however give information on the influences of building facilities’ locations and capacities. Therefore, either a canteen might be relocated from the top floor down to the first floor during the planning process or the capacities and operating hours are subject to future limitations.
3 Quality of Service Criteria
3.1 General aspects
If lift users are asked to name the 3 worst characteristics of a poor lift system, most of them will answer:
- ‘I don’t like waiting too long.’
- ‘I don’t like crowded cars.’
- ‘I don’t like it, when the lift stops often.’
3.2 Quality of Service Criteria
If we translate this into lift terminology, we can say that the three most important ‘Quality of Service Criteria’ are:
- Waiting Time,
- Car Load and
- Number of Stops during the journey.
A variety of further values can be obtained from a simulation and they should be used for additional information, when required by the client. For JI, the basis for lift service evaluations should be the first two criteria mentioned above: Waiting Time and Car Load. The number of stops is automatically reduced by considering a destination control system.
3.3 Average Waiting Time (AWT)
Waiting Time (WT) is defined as the time period from call registration at the terminal until the door of the serving car starts opening on the board floor. This definition is in line with the definition given in the recent literature and it is internationally accepted.
During a simulation, the WT for each individual passenger is identified. The AWT represents the mean value of the individual WT of all passengers monitored during each simulation period.
In existing buildings with modern monitoring systems, all movements and calls are recorded. Based on these data the WT of all lift users for any call can be identified as well as the AWT during special time periods, e.g. for up-peak period, for lunchtime period, for a whole day, for a whole month, etc. However, the value of AWT is meaningless without the information of the related time period.
3.4 Average Start Load
The Average Start Load is understood to be the average car loads measured at departure from the main landing and monitored during the (up-peak) simulation period.
In order to keep it simple, the Average Start Load (as a result of a simulation) should be expressed as a percentage related to the ‘Rated Load’. The Rated Load, expressed as persons, is derived from the European code EN 81-1, table 1.1. In real lifts the maximum practical car load is about 80 % of the rated load.
For simulations the maximum car load should be 80 % of the rated load rounded down to an integer value. We need the “maximum car load” as an input for simulations. The rated load, expressed as persons, e.g. of an 1800 kg car is 24 persons (75 kg per person); 80 % of 24 is 19.2 persons. Rounded down to 19 persons, this should be the maximum practical car load.
3.5 Average Number of Intermediate Stops
During the journeys the lift stops due to hall calls or to allow passengers to alight.
The average number of intermediate stops represents the mean value of the individual number of intermediate stops (without the stop at start and destination floor) of all passengers monitored during the simulation period.
Note: We have to make a difference between the number of stops during one round trip and the number of stops related to the individual passenger. The first figure is known from RTT calculation.
In every case, the figures are smaller with DCS than with Conventional Control. With conventional control the number of stops rises continuously with traffic intensity and with the number of served floors. DCS generally reduces the number of stops (idea and target of DCS) compared to conventional control.
Excursion: ‘Destination Time’
Destination Time is mainly influenced by the number of intermediate stops. The term has been created in the beginnings of the DCS development, in order to argue against the fact that waiting times with the DCS might be slightly longer compared to Conventional Control Systems. However, due to the reduced number of stops, the destination time was shorter.
Before DCS, the Destination Time (Destination Time = Waiting Time + Transit (Journey) Time) was not a ‘Quality of Service Criterion’ at all, but unfortunately, it has found its way into nowadays evaluation systems.
Residents or workers in tall buildings know that it takes longer to travel to the 50th floor than to the 5th floor. It’s like a flight from Berlin to Miami (11h) compared to a flight from Berlin to Frankfurt (1h). Long distance travellers are prepared for longer flight duration (Time to Destination) and they naturally accept it.
JI think that Destination Time is a misleading criterion and therefore shall not be used for evaluation purposes.
4. Evaluation
4.1 Evaluation of existing lift installations
For existing buildings, waiting time is the main criterion to classify the quality of lift service. After final hand over and a reasonable run-in period, measurements via the installed lift monitoring system shall be executed. The lifts should achieve excellent or good waiting times in accordance with Table 1. In case of non-achievement, the lift manufacturer should pay a reasonable penalty.
Note: An hour of peak activity is taken, in order to obtain practical results
This table is known for many years and generally accepted. Typical measurements are for a month, a day (24 hours) and peak periods. In special cases one grade less can be accepted e.g. if the lobby is glassed. With DCS one can assume that nearly every user gives an individual call; system response time for DCS is then identical with average waiting time. Compared to conventional control systems longer waiting times with DCS are accepted, because passengers are waiting with less stress next to the designated lift and do not need to look forother doors to open.
Excursion: A ‘Class A’ High Rise Office Building Frankfurt, Germany
The example of this office building shall demonstrate the capabilities of a modern destination control system. The building was equipped with high prformance lift components and immediately occupied after final handover by a single tenant with 10 % more people than originally calculated. The project was presented during the last CIBSE open forum in March 2010 by Dr M. Siikonen and the facts were mistrusted. We confirm that these lifts are operating excellent up to now, still with high occupation.
By revealing the relevant building and lift data, we herewith encourage everybody to do his/her own traffic analysis. We know that some colleagues already got the opportunity to visit this building, thereby being able to justify the excellent lift performance.
Traffic survey and evaluation during peak hours
- Average waiting time 12 s
- 83.1 % of waiting times less than 30 s (excellent means 75 % or more)
- 96.6 % of waiting times less than 60 s (excellent means 98 % or more)
- Evaluation: excellent
- Average waiting time 17 s
- 75.6 % of waiting times less than 30 s (excellent means 75 % or more)
- 94.8 % of waiting times less than 60 s (excellent means 98 % or more)
- Evaluation: excellent
Long-term traffic survey
- Average waiting time 15 s
- 88.4 % of waiting times less than 30 s
- 96.8 % of waiting times less than 60 s
- Max. waiting time 1439 minutes (approx.. 24h)
- 94200 passengers
- Average waiting time 10 s
- 90.3 % of waiting times less than 30 s
- 98.0 % of waiting times less than 60 s
- Max. waiting time 48 minutes
- 137104 passengers
Findings from Long-term traffic survey
Comparing the 2 months we can conclude that the figures for waiting times during a month are influenced by the long waiting time on one single day. Nobody could believe that there was a passenger, who waited for 24 hours.
In contrast to October, where school holidays take place, there is a much higher number of passengers in November. We think, also in November the lifts are not operating on their limits.
Extremely long waiting times are typical for DCS (maybe some lift companies’ monitoring systems eliminate this figures). With conventional control systems the waiting times usually end, when the next lift in the right direction arrives. With destination control systems the waiting times end, when the designated lift arrives. In the case this lift is switched off and there is an open demand, the waiting time runs until the lift arrives on the floor, where the open demand is, after being switched on again. That is the reason, why the maximal measured waiting times sometimes can be extremely high.
4.2 Evaluation of Simulation Results
Based on the long term experience with DCS installations in office buildings, JI uses the criteria of Table 2 to evaluate JI simulations results.
Excursion: ‘CIBSE Guide D, 2010’
As a lift consultant JI have to deal with the CIBSE Guide because other engineers do it. For us, CIBSE Guide is no international accepted regulation – it is a trial to give some guide lines. But the guide lines are not corresponding to the praxis. One result is that buildings designed according to CIBSE are over-elevated. Thus the building efficiency decreases and energy consumption for the lifts increases.
CIBSE Guide says (4.8.5) that DCS is good for up peak but less effective for mixed traffic. May be it was so at the beginning. Due to our experience state-of-the-art DCS are much more effective than conventional control systems during all traffic situations. We simulated existing lifts in existing buildings in line with CIBSI Guide D with the result that the lifts are “unclassified” but in reality the lifts are excellent.
5. Conclusion
The matter of ‘Difficulties in Comparing the Results of Lift-Traffic-Simulations’ is not new and has been discussed for more than 5 years now. Although important contributions have been made to the issue and useful tools already exist, an agreement about an accepted simulation process is still in abeyance, due to different policies and ideologies of the involved parties.
A thorough comparison of simulation results can only be enabled when done on a defined basis with the same simulation procedures and input data. A ‘Simulation Data Sheet’ can help as a first approach.
The presented procedures and opinions probably are another sight of view and do not represent the required solution of the problem. However, they may help to discuss ways of simplified but exact simulation procedures in order to find a pragmatic and basic compromise – at least for high rise office lifts with DCS.
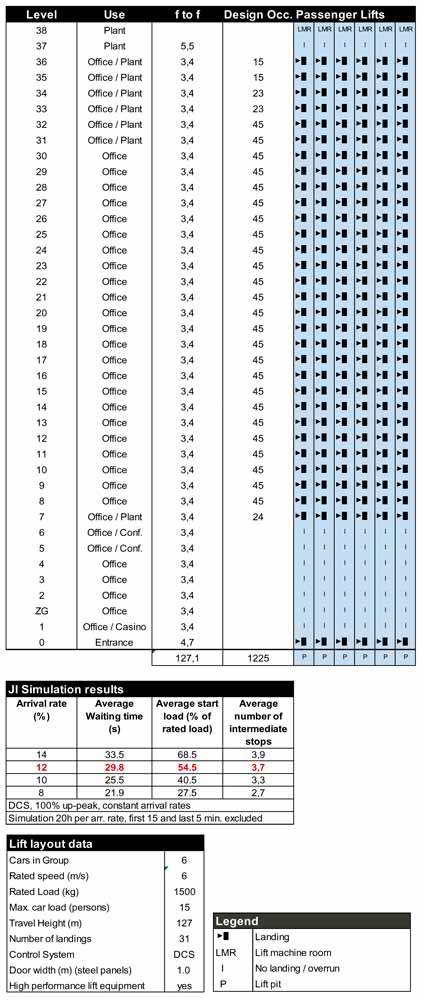
Figure 2. Lift Scheme and JI Simulation Results during design phase 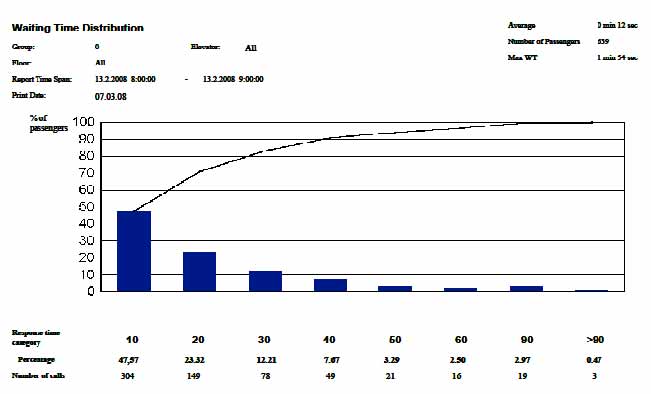
Figure 3. Waiting time distribution February 13, 2008, 8:00 am – 9:00 am 
Figure 4. Waiting time distribution February 13, 2008, 12:00 am – 1:00 pm 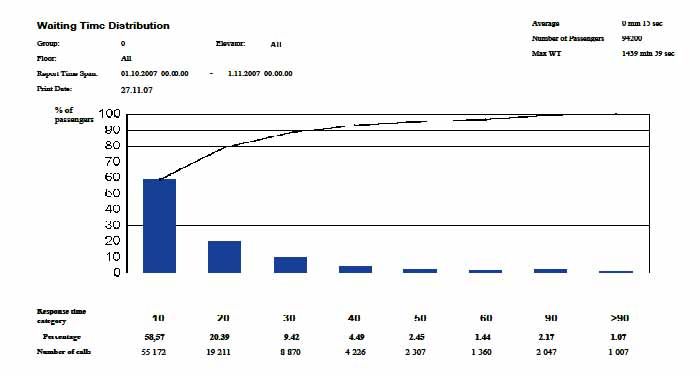
Figure 5. Waiting Time Distribution October 2007 
Figure 6. Waiting time distribution November 2007 
Table 2. JI Quality of Service Criteria for lift traffic simulations in office buildings 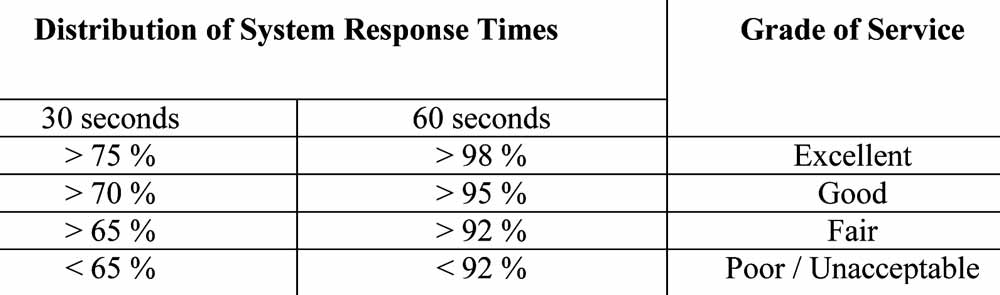
Table 1. Average System Response Time Performance in Office Buildings (Note: An hour of peak activity is taken, in order to obtain practical results) 
Appendix A Lift Simulation Data Sheet
References
Finschi, Dr, Lucas (2010). State-of-the-Art Traffic Analyses. Elevator Technology 18, Proceedings of Elevcon 2010, pp.106-115
Siikonen, Dr, Marja Liisa (2009). Elevator Traffic Simulation Procedure. Lift-Report 35. Jahrgang (2009), Heft 5, pp.86-92
CIBSE Guide D: 2010 (2010). 3.7.5 Target passenger times and lift system response times, Table 3.8. ISBN 978-1-906846-16-9
CIBSE Guide D: 2010 (2010). 4.6.4 Design Templates, Notes of table 4.3. ISBN 978-1-906846-16-9
CIBSE Guide D: 2010 (2010). 4.8.5 Discussion of examples. ISBN 978-1-906846-16-9
CIBSE Open Forum March 2011. Notes of the CIBSE Lifts Group: Lift (US: Elevator) Traffic Analysis & Simulation Open Forum, 1st & 2nd March 2011
Jappsen, Hans and Rieke, Olaf (2010). Difficulties in Comparing the Efficiency of Different Destination Control Systems. Elevator Technology 18, Proceedings of Elevcon 2010, pp.435-437
Get more of Elevator World. Sign up for our free e-newsletter.


