The first of this two-part History series examines early elevator datasets.
This is the first of two articles that will examine elevator safety in the U.S. between 1870 and 1920. This month’s focus is on accident reporting and statistics; next month’s article will address accident causes. The impetus for this investigation was the recent acquisition of a short, 32-page pamphlet with a lengthy title: Elevator Dangers: 401 Fatal Accidents of Freight and Passenger Elevators in Chicago and Cook County, From December 1904 to March 1916 Inclusive published by the Public Safety Commission of Chicago and Cook County. The fact that a single major metropolitan area averaged 40 elevator deaths per year during a 10-year period prompted new questions about elevator safety.
The vertical-transportation industry’s commitment to safety has been a critical aspect of its history from the beginning. However, a question that has not been fully explored concerns the effectiveness of this longstanding commitment. The answers to this question differ when examining the primary periods of elevator safety history, which may be defined as pre and post reliable door interlocks, and pre and post national elevator safety codes. While these eras overlap, the commonality is that, prior to the 1920s, no national standards or regulations existed that mandated specific elevator safeties. It is also important to note that no national accident statistics were formally collected during this period, and individual states and cities employed a wide variety of data-gathering metrics. Thus, while the datasets explored for this investigation are representative of the period from 1870 to 1920, in many instances, they are fragmentary (indicating the need for further research) and, thus, do not tell the complete story.
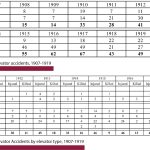
One of the most extensive datasets from the 19th century concerns elevator fatalities in New York City (NYC). Beginning in 1870, the annual reports of the Department of Health included statistics on deaths caused by “accidents or negligence,” which included elevator-related deaths. This data was consistently reported from 1870 to 1894 and reveals a slow but steady increase in the number of elevator-related fatalities (Table 1). This increase likely reflects the growth of elevator usage during this period, as well as the growth of the city’s population. While a complete dataset for 1895-1899 has not been found, data for the opening decade of the 20th century also reveals an increase in the number of elevator fatalities (Table 2). Detailed information on accidents in a key part of NYC was published between 1911 and 1920 by the Bureau of Buildings of the City of New York for the Borough of Manhattan. This source separated passenger elevators from freight elevators, included fatal and nonfatal accidents, and listed the number of passenger elevators “in service” per year (Table 3).
The next-largest dataset found was assembled by the Chicago Department of Health from 1881 to 1905 (Table 4). The number of deaths per year follows the same pattern found in NYC: from 1881 to 1890, there was an average of 13 deaths per year. This increased to 15 deaths per year during the next 10-year period and averaged 17 deaths per year from 1901 to 1905. Information on elevator-related deaths was also collected by the Chicago and Cook County Coroner’s Office. They published a report in 1914 prepared in partnership with the Public Safety Commission of Chicago and Cook County that examined elevator fatalities from December 1904 to March 1916. In addition to statistics on fatal accidents, the report also included information on elevator type, accident location and victim identity (Tables 5-8). The age of the victims was also identified, a fact that highlights the tragic nature of many of these accidents (Table 9).
The different data sources for NYC and Chicago (the Departments of Health, Bureau of Buildings and Coroner’s Office) raise questions about data collection, metrics and reporting beyond the scope of this initial investigation. Similar questions may be directed at the primary data source for elevator accidents in Philadelphia from 1908 to 1919. This data was collected by the Bureau of Elevator Inspection (established in April 1908) and included information on fatal and nonfatal accidents (Table 10). This dataset also included, for 1911-1918, information on elevator usage (passenger or freight) and elevator type (electric, hydraulic, belt or hand power) (Table 11).
During the period under investigation, it was also common for individual states to collect accident data. These included broad collections that embraced all types of elevators, as well as instances where data gathering targeted specific uses, such as in factories and industrial settings. The most comprehensive statewide dataset discovered thus far was found in the annual reports of the chief of the Massachusetts District Police for 1886-1913. This data included accident statistics for the entire state. From 1890 onward, the reports identified fatal and nonfatal accidents (Table 12).
While no national government agency collected elevator accident statistics during this period, an effort was made by researchers associated with the U.S. Bureau of Standards to assemble a national dataset. This work was conducted by electrical engineer Charles E. Oakes and mechanical engineer John A. Dickinson, and was published in 1921 in Technological Papers of the Bureau of Standards, No. 202: Results of a Survey of Elevator Interlocks and an Analysis of Elevator Accident Statistics. Oakes and Dickinson, perhaps recognizing the impossibility of gathering official data (due to the diversity of reporting agencies, methods and metrics), employed a thorough (but decidedly unscientific) approach. They utilized clipping bureaus to gather accident data for January 1913-July 1918.
Now more widely known as media monitoring services, clipping bureaus were businesses that subscribed to a wide array of newspapers and magazines. For example, the Romeike Press Clipping Service of NYC promised users access to more than 3,000 newspapers and 1,000 magazines. A client would request articles on a specific subject, such as elevator accidents, and the clipping bureau would comb through its material and, at the time, literally clip or cut out appropriate articles and send them to the client. The clippings assembled for and analyzed by Oakes and Dickinson allowed them to present the first national dataset on elevator accidents. These statistics addressed fatal and nonfatal accidents, as well as the “type” of accident (Table 13). The latter category was somewhat generic, in that it was defined as public, semipublic and industrial. While the data-collection methodology may be slightly suspect, the fact that this approach yielded information on 971 elevator-related fatalities and 1,386 injuries (all of which occurred over a five-and-a-half-year period) speaks to the seriousness of this problem in the early 20th century.
Several of the data sources examined for this initial foray into this important topic also included information on accident causes, which ranged from simple categorizations to detailed descriptions. This material will be examined next month in “Elevator Accidents 1870-1920: Causes.”
- Table1-5
- Table 6-9
- Table 10-11
Get more of Elevator World. Sign up for our free e-newsletter.


