Monitoring Elevator Energy Usage in Real-Time
Jun 1, 2011

Arizona State University’s research and education center provides a solution for determining the energy efficiency of elevators.
by Rich Madarasz, Jimmie Anicich, Rob Vandling and Kathy Mutch
Arizona State University (ASU) is itself a city of 82,000 students, fac-ulty and staff. ASU’s Global Institute of Sustainability (GIOS) is a leading research and education center for planning and adapting to a changing world. GIOS is the cornerstone of ASU’s commitment to sustainability in its operations. The university has a goal to achieve carbon neutrality by 2025. Energy conservation and efficiency are key strategies to achieve this goal.
With over 250 structures, energy efficiency is a major concern at ASU. Sixteen projects, comprised of 34 buildings, have received Leadership in Energy and Environmental Design® certification. Solar power, wind power, co-generation, chilled water storage and innovative architectural features are some of the technologies utilized to reduce ASU’s energy consumption. A sophisticated campus-wide monitoring system tracks energy use in real time and makes the information publicly available (http://cm.asu.edu). The Challenge
ASU has a diverse collection of over 200 elevators of different ages, types and manufacturers. Nearly every type of elevator is currently in use: traction, hydraulic, high rise, low rise, service, old and new. It is important to understand just how much energy these machines use. This information can be used to make adjustments to the equipment, determine which elevators need to be modernized and justify costs.
Most of the buildings at ASU are monitored on an aggregate basis. That is, all electricity-using equipment is combined to determine the efficiency of the building. The next step is to determine which devices are using this energy, when they are in use and how they are operating. For elevators, this requires collecting high-resolution data on a trip-by-trip basis over an extended period of time. This new monitoring system needs to be portable so that it can be easily moved from one elevator to another. It also needs to be integrated with the campus-wide energy-monitoring system.
One Solution
In many cases, determining the energy efficiency of an elevator has been based on assumptions using a few measurements [1]. Qameleon Technology has recently implemented real-time energy-monitoring capabilities in its QarVision™ Elevator Performance Analyzer (page 129). The QarVision system detects and records what the elevator is actually doing, rather than what the controller is telling it to do. It operates like an automated passenger, 24/7.
QarVision has two modules – one to monitor the elevator car, and the other to monitor the machine-room equipment. The main module, located on top of the elevator car, measures acceleration, speed and gate activity.
The machine-room monitor (MRM) measures motor cur-rent, motor temperature, room temperature, hydraulic pressure, and relay or magnetic switching. The MRM sends all of its data via Wi-Fi to the main module, which stores the data along with its own. A service technician can evaluate the elevator’s performance in real-time and retrieve stored data wirelessly, using a Wi-Fi enabled per-sonal digital assistant or laptop. When remote capabilities are needed, QarVision often uses a cellular data connec-tion that enables it to be operated from anywhere over the Internet.
QarVision is a standalone diagnostic system, but in this case, it needs to work in conjunction with ASU’s energy-monitoring system. The QarVision software was modified to provide a ModBus transmission control protocol interface, which is used by all of ASU’s energy sensors. Specific data about energy consumption are pro-vided to the campus monitoring system every second. Instantaneous current and power are reported, along with energy used on the last trip of the elevator. This data is in addition to all of the normal QarVision information, which is available remotely and independently.
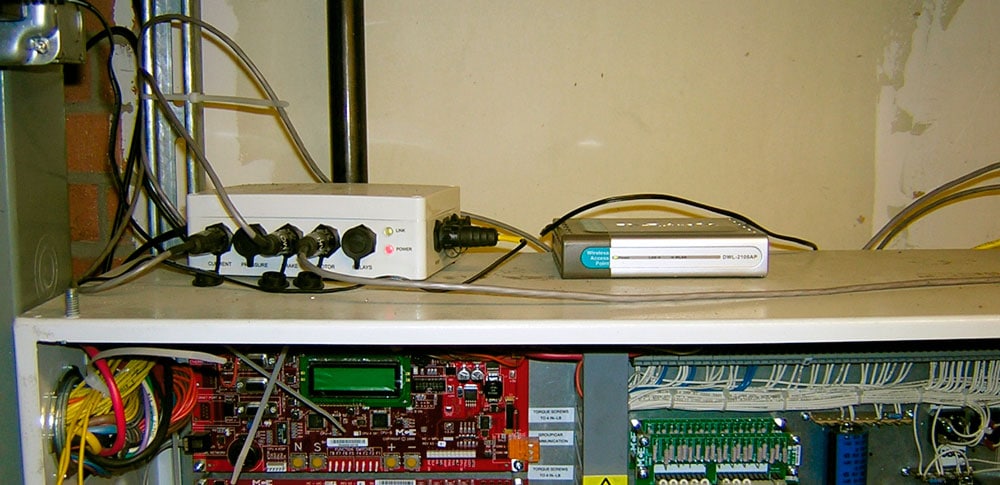
All of the buildings on the ASU campus have wired Ethernet connections that are used for the energy-monitoring system. Wired Ethernet could not be connected directly to the QarVision unit on top of the elevator car, so Wi-Fi access points were added in the machine room. In some cases, Ethernet did not extend to the machine room, so QarVision connected to the campus-wide Wi-Fi network (Figure 1). This scheme also allowed QarVision to be moved from one location to another without reconfiguring the network, since it is always connected, regardless of its location.
Monitoring Elevator Energy
The purpose of the elevator-monitoring effort is to determine how and under what conditions an elevator consumes the most energy. Since most elevators on the ASU campus are available 24/7, they should be evaluated over a few weeks of operation. There are no published standards for how much energy older elevators are sup-posed to use, so, for now, we will compare elevators of similar size, speed and number of floors, without taking into account age or cost. Several tests are conducted automatically on each elevator. Some examples of the data collected are presented here.
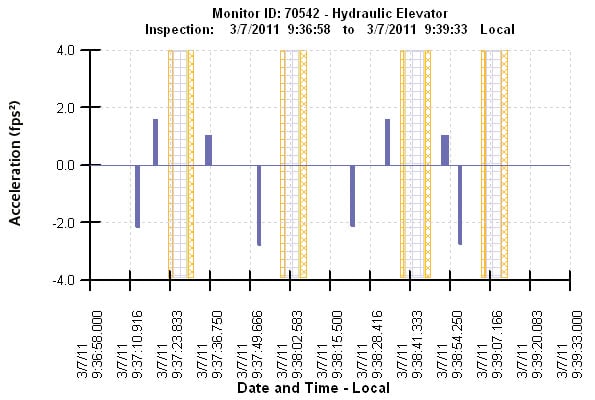
The QarVision system displays the data collected from each trip of the elevator in graphical form and statistical reports. The first example is a roped hydraulic elevator with five landings. Figure 2 shows two trips down and two trips up for this elevator. The acceleration and deceleration of the elevator car are shown in a set of blue or red bars. The height of the bar indicates the magnitude of the acceleration, and its width shows the duration. A blue bar is normal acceleration or deceleration. The yellow and white areas behind the acceleration bars show the actions of the gate. They indicate the state of the gate relative to the motion of the car. The width of the hatched areas is the time it takes for the gate to open and close.
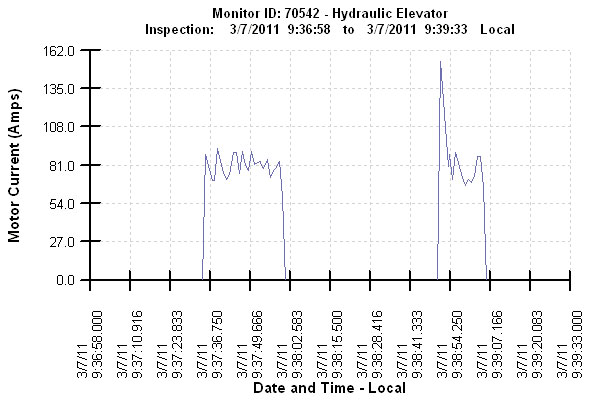
Figure 3 shows the corresponding motor current for these trips. As expected, the down trips draw no motor current. The current drawn on the up trips is relatively constant for the duration. In some cases, there is a significant spike in the motor current on startup. The motor starts to run just before the car starts to move and continues for a short time after it stops.
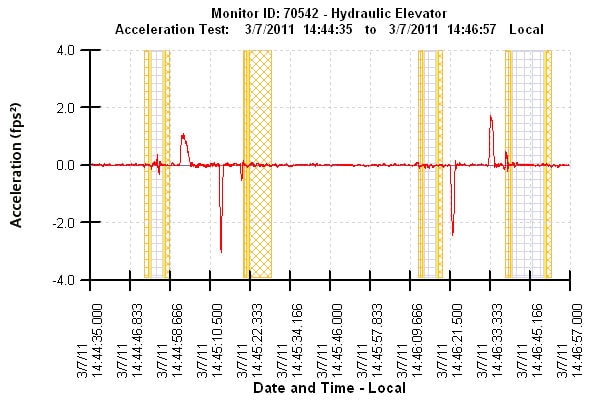
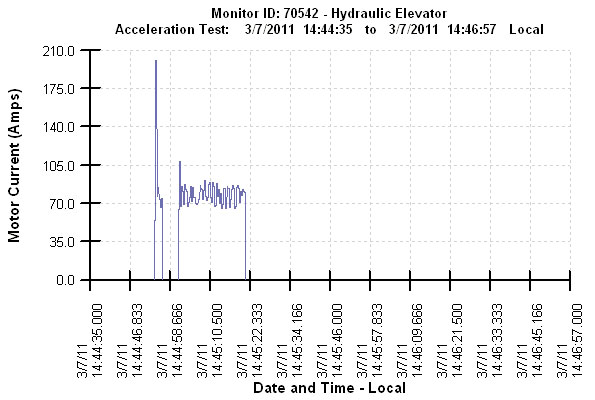
A more detailed view showing the relationship between acceleration and motor current is shown in Figures 4 and 5. These graphs show an up trip, and a down trip.
The acceleration and current were recorded at 50 samples per sec. There is a slight startup spike in the current at the beginning of the up trip. Note the high current spike that occurred when the door was open and the elevator releveled.
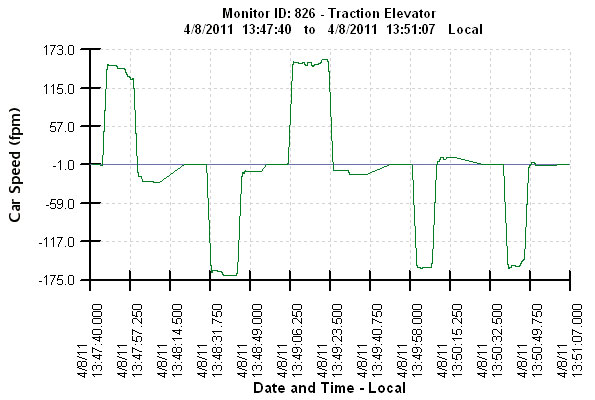
The energy consumed by the elevator for a particular trip is dependent on the motor current, its speed and how far it travels. Figures 6 and 7 show the speed profile of the elevator and the total energy for the trip, respectively. The graphs show a down trip of three landings, two up trips of two landings and one down trip of two landings.
The purpose of the monitoring effort is to also evaluate different types of elevators used in the same type of operation. For comparison, a test was run on a traction elevator in the same building.
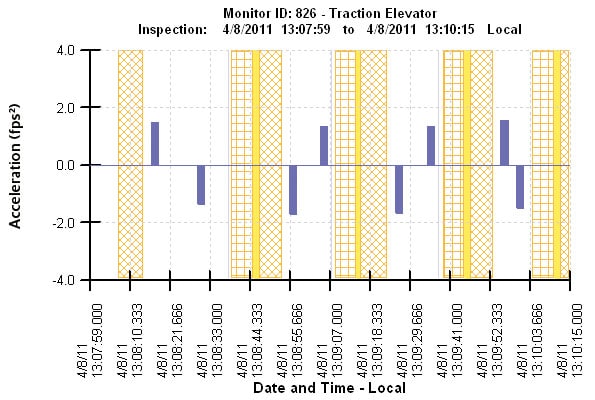
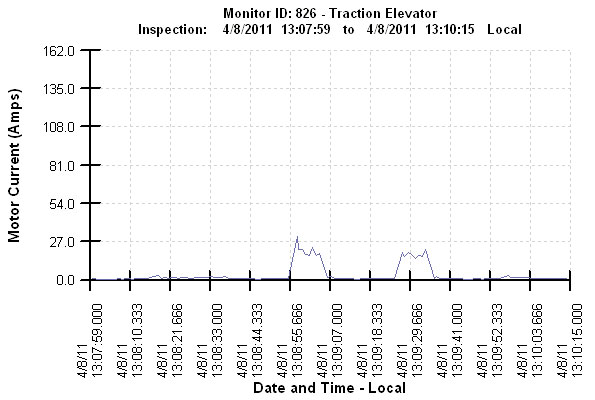
These two elevators have similar traffic patterns and are used alternately by the building’s occupants. Figures 8 and 9 show representative trips and the amount of current drawn.
The current profile for a traction elevator is different than that for a hydraulic elevator. The current will vary depending on the location of the elevator in the hoist way, the weight of the counterweight and the load. Since the traction elevator has a counterweight, it draws the most current as it moves down and very little when it moves up.
Figures 10 and 11 show the higher-resolution view of the current versus the acceleration relationship. For these two elevators, the hydraulic unit draws about four times as much current as the traction elevator. (Compare Figure 11 to Figure 5 for the hydraulic elevator.)
The traction elevator travels at approximately 1.5 times the speed of the hydraulic elevator. Since the energy used for a trip is a function of the current and the length of the trip, this traction elevator uses considerably less energy than the hydraulic elevator.
Comparing different elevators needs to be done objectively, taking into account the traffic and conditions under which the elevators are used. The energy used by the two elevators described above is shown in Figures 14 (hydraulic) and 15 (traction). The graphs show the energy consumption for one typical weekday for the two elevators.
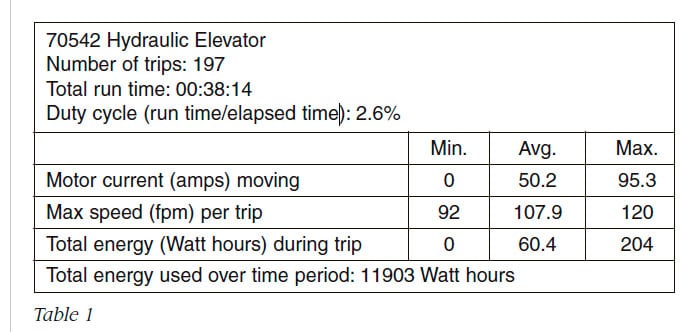
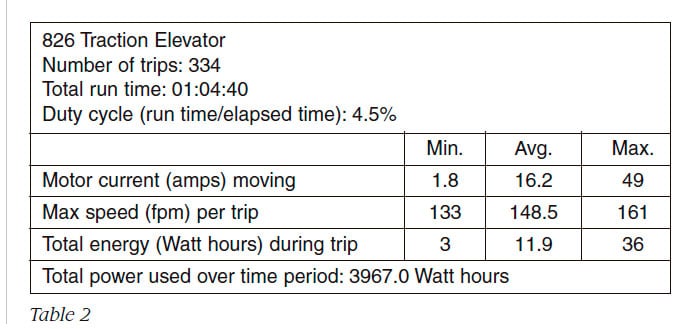
Clearly, the traction elevator in Table 2 is more efficient. Even though it made more trips (334 versus 197), it used only one-third as much energy as the hydraulic elevator. What’s Next?
The goal of this effort is to evaluate the energy usage of all of the elevators on the ASU campus in a standardized way. By recording trip-by-trip data over an extended period, a better picture of the energy efficiency of individual elevators under various conditions can be developed.
Energy efficiency can be an important factor when considering elevator upgrades and modernization. Some upgrades can be justified on the basis of energy cost savings. Having a standardized set of records is the first step in this process. These energy measurements also form a useful baseline for maintenance.
The elevator energy data and monitoring capability also provide a research opportunity for GIOS faculty and students. What percentage of a building’s energy consumption is due to elevator usage? Would regenerative elevator controls justify their additional cost?
Bonny Bentzin, director of Campus Sustainability Practices, GIOS, ASU, said:
“Understanding the details of energy usage on campus is key to utilizing education to spark behavioral change and drive decision making on infrastructure choices to reduce overall consumption through efficiency and conservation practices.”
For more information about QarVision, contact Qameleon Technology at phone: (480) 495-2777 or visit website: www.Qameleon.com. To learn more about the GIOS, visit website: www.sustainability.asu.edu.
References:
[1] Urs Lindegger, “The Studies in Europe and the Energy Efficiency Guideline VDI 4707,” ELEVATOR WORLD, April 2011, p. 92.
Get more of Elevator World. Sign up for our free e-newsletter.

