Passenger Batch Arrivals at Elevator Lobbies
Jan 1, 2013
by Janne Sorsa, Juha-Matti Kuusinen and Marja-Liisa Siikonen – Passenger Batch Arrivals at Elevator Lobbies
Abstract
A typical assumption in elevator traffic analysis is that passengers arrive at the elevator lobbies individually. A recent study in an office building shows that passengers actually arrive in batches, whose sizes depend on the time of day. This article summarizes the results of this study and introduces batch-size distributions for morning and mid-day traffic in office buildings. The batch arrival process is described along with its effect on the elevator analysis and traffic planning tools. Individual and batch arrivals are compared numerically by both traditional calculations and simulations.
1. Introduction
Traffic analysis and simulation models generally assume that passengers arrive at the elevator lobbies individually. The concept of individual arrivals is based on the study of Alexandris (1977), where he observed passenger arrivals during the morning up-peak in several office buildings and concluded that the arrivals follow a Poisson process. However, intuitively it is clear that people do not always travel alone but rather in groups with friends or families. Recently, Kuusinen et al. (2011) found that passengers actually arrive at the lobbies in batches, not so much in up-peak as in mid-day traffic. Such a process can be modelled as a compound Poisson process (Ross 1992).
The well-known round trip time equation for up-peak (e.g. Barney 2003) and its more accurate form (Roschier and Kaakinen 1979) assume that passenger inter-arrival times are uniform. Round trip equations have also been derived for the Poisson arrival process (Tregenza 1972, Peters 1990, Siikonen 1997). These equations give an estimate of average round trip time, as they employ a probable number of stops and highest reversal floor. The equations are based on a constant car load, which is usually assumed to be 80% of either rated or actual car capacity (Barney 2010).
In elevator traffic simulation, it is possible to model elevator passengers and their arrivals more realistically than in up-peak calculations. Most importantly, simulation enables the analysis of any kind of traffic situation. In simulation, passenger arrivals are generated randomly according to a Poisson process (Siikonen et al. 2001, Peters 2002). The random arrivals cause variation in car load factors when the elevators leave the lobby, which, on the other hand, also leads to variations in elevator round trip times. The average round trip time of an up-peak simulation approaches the calculated value (Siikonen 1993). So far, passenger batch arrivals have remained virtually an untouched research subject. In this article, first the field study of Kuusinen et al. (2011) regarding batch arrivals is summarized. Then, both calculation and simulation models for batch arrivals are introduced, and finally their effect is analyzed by calculated and simulated results.
2. Measured Batch Arrivals
A study on the passenger arrival process was carried out in a 16-floor high-rise office building served by a group of four elevators (Kuusinen et al. 2011). The incoming traffic on the entrance floors, namely, the first two floors, was recorded with digital video cameras during the morning up-peak and the lunch hour period on a regular office day. In addition to the video recordings, traffic data from each stop of each elevator were obtained from the elevator monitoring system and the group control system. The traffic data of one elevator stop consists of timestamps of the stopping elevator’s state (e.g., stop time), number of passengers entering and leaving the elevator (passenger transfer data) and calls registered by the passengers.
In the study, a socially connected batch was defined to consist of passengers who
- arrive at the elevator lobby at the same time;
- arrive at the elevator lobby through the same door or from the same direction;
- enter the same elevator;
- travel to the same destination.
Rules (1) and (2) are related to the actual passenger arrivals and the arrival process. Rules (3) and (4) specify sub-processes based more on social relationships. This information is important since the more batches, the fewer passengers with different destinations, which results in fewer stops during the round trip and greater handling capacity.
The arrival times of the passengers were determined on the basis of the video recordings. The arrival time of a batch was defined as the arrival time of the first passenger to enter the elevator lobby. The batches were determined from the video recordings and the monitoring system data using a procedure described in Kuusinen et al. (2011).
Table 1 shows the batch-size distributions, given both in absolute and relative numbers, for the first and the second entrance floor during the morning up-peak and the lunch hour period. These distributions were obtained by combining the distributions observed during successive 15-min intervals within the periods. It can be concluded that, during the morning up-peak period about 90% of the batches consisted of one person and 10% of two or more persons. This means that about 80% of the passengers arrived alone. During the lunch-peak period about 70% of the batches consisted of one person and 30% of two or more persons, which means that only about 50% of the passengers arrived individually and 50% in batches consisting of two or more persons.
If the batch arrivals occur randomly in time, then the arrival process can be modelled with a compound Poisson process (Ross 1992), which is a generalization of the ordinary Poisson process. Let {N(t), t ≥ 0} be a Poisson process where N(t) is the random number of events occurring until time t. The equation for the compound Poisson process {X(t), t ≥ 0} is:
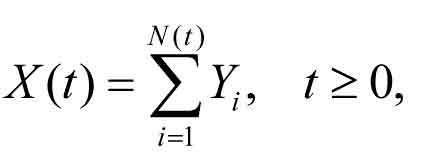
where X(t) is the number of passengers arriving until time t, N(t) is the number of batch arrivals, and Yi is a random variable denoting the size of the ith arriving batch. The Yi are assumed to be independent and identical, and follow the same batch-size distribution. The compound Poisson process reduces to the ordinary Poisson process, if the probability that passengers arrive alone equals one and the probabilities of larger batches equal zero.
Kuusinen et al. (2011) studied whether eqn (1) can be used to model the batch arrivals at elevator lobbies. Because the arrival rate varied from interval to interval, the well-known c2 test for the Poisson process could not be used. The test constructed by Brown et al. (2005) does not assume that the arrival rates of different intervals are equal, nor does it require grouping of data, which is the case in the c2 test. Hence, this test was applied to study the assumption that the batch arrivals form a time-inhomogeneous Poisson process with a constant arrival rate for every 15-min interval, i.e., eqn (1) models the batch arrivals within every 15-min interval. The results confirmed the assumption for both entrance floors as well as for both morning up-peak and lunch hour traffic.
3. Passenger Batches In Elevator Planning Tools
Passenger batches have not been considered in elevator planning literature at all except for Gaver and Powell (1971) who briefly discuss the “effective number of passengers” as passengers tend to travel in groups. The consequence of grouping is that the number of independent destination floor choices becomes less than the actual number of passengers in an elevator. To analyze the effect of batches, the traditional up-peak formulae as well as simulation models need to be modified.
3.1 Revised Up-peak Formulae
The necessary modifications for a generalized round trip time, RTT, are based on the idea that the number of independent destinations equals the number of batches instead of the number of passengers as in the traditional equations. Assuming C passengers in an elevator, the number of batches can be defined by dividing the number of persons by the expected number of persons in a batch, C / b , where the expected batch size b for all batch sizes i = 1, …, B is
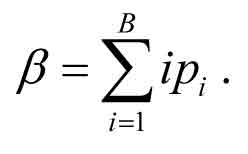
The figure C / b is used instead of C in eqns (3) and (4) for the probable number of stops, S, and the highest reversal floor, H, in a building with N floors (see e.g. Barney 2003). The round trip time is given by eqn (5), where td-t-d is the door-to-door time of a single-floor flight, tv is simply estimated as the average floor height divided by the rated speed v, td is door dwell time or photocell delay, and tp is the transfer time of a single passenger.


Eqns (3)-(5) assume that the batches perfectly satisfy rules (1)-(4) of Section 2. Number of passengers C refers to average car load in up-peak. Usually, it is defined as 80% of rated car capacity. To reproduce eqns (3)-(5) in an up-peak simulation, car loads up to 100% of rated car capacity must be allowed, the batches in the simulation must satisfy rules (1)-(4) of Section 2, and each batch must travel as a whole in one car. Note that the allowance for full car loads is also needed to match up-peak simulation with individual arrivals to the traditional round trip time formulae.
3.2 Batch Arrivals in Building Traffic Simulator
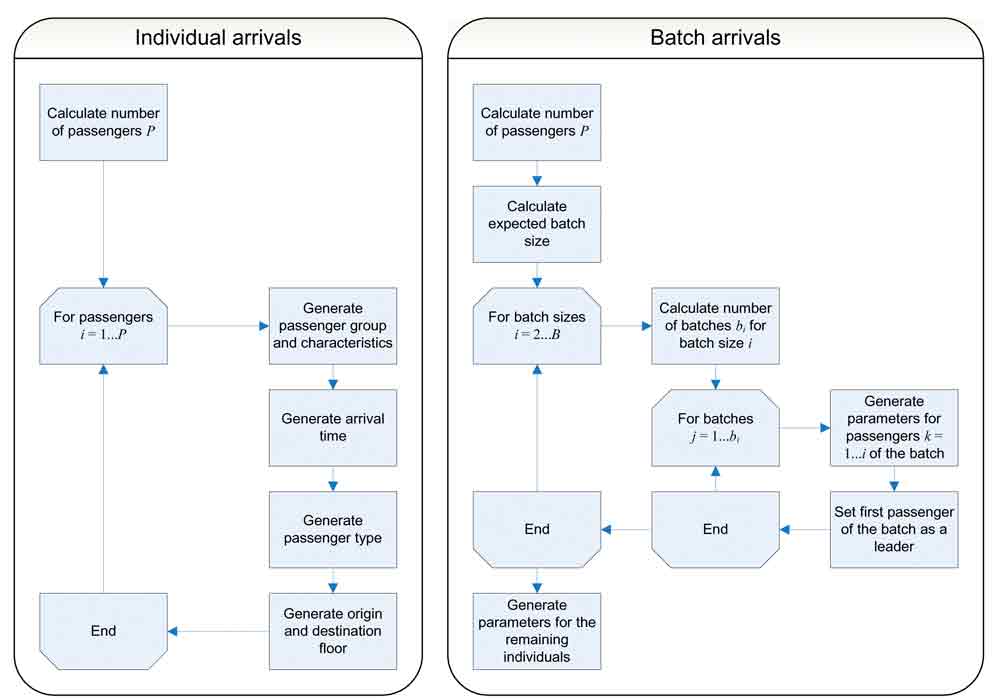
In any simulator of elevator traffic, the generation of passengers drives the whole simulation process, and the Building Traffic Simulator is no exception to this rule. Figure 1 below depicts the passenger generation procedure: on the left, the ordinary generation of individual passengers, and on the right, the newly developed procedure to generate batches of passengers. The passenger generation procedure is executed for each time period T of the simulation, e.g. 15 minutes, for which the arrival rate and the traffic components are defined.
Considering first the individual arrivals, the procedure is as follows. First, the total number of passengers to be generated during time T is calculated deterministically using arrival rate l given in passengers in five minutes, P = lT / 300. A deterministic calculation of the number of passengers is preferred to guarantee that the simulation really generates as many passengers as defined by its parameters. Then, for each of the P passengers, the following steps are executed (see Susi et al. (2005) for more details):
Passenger group is picked up randomly. Passenger group parameters contain, for example, passenger transfer time, walking speed, and space demand. In standard simulations, passenger transfer time equals 1 second (boarding or alighting), walking speed is 1 m/s, and space demand is 1 person.
Arrival time t is generated randomly: t = t0 + Rnd(0, 1) T, where t0 denotes the start time of the time period and Rnd(0, 1) denotes a random number between 0 and 1.
Passenger type, i.e. whether the passenger is incoming, outgoing, or interfloor passenger, is selected randomly using the traffic component probabilities.
Origin and destination floors are selected randomly depending on the passenger type. For example, the origin floor of an incoming passenger is selected as one of the entrance floors according to entrance floor attractions, and the destination floor is selected as one of the upper floors according to the population distribution.
The above procedure requires some modifications for generating batches of passengers. The number of passengers, P, is calculated first exactly as in the case of individual arrivals along with the expected batch size b. Then, for all batch sizes i = 1, …, B, the number of batches bi of size i, i ≥ 2, are calculated using eqn (6). The remaining individual passengers not yet included in the batches are handled as a special case according to eqn (7). This ensures that the total number of batches in the simulation becomes deterministic with respect to simulation parameters.

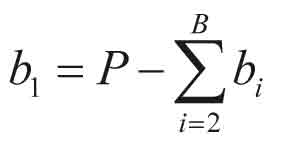
Once the number of batches is defined, the procedure becomes a rather straightforward application of the above-mentioned steps. However, a totally new concept, leader of the batch, needs to be introduced. In the simulation, members of a batch follow the actions of its leader. For example, the batch enters a car as a whole. It turns out that this behavioural model is critical in reproducing the up-peak round trip times as predicted by eqns (3)-(5) since otherwise the number of stops becomes greater than expected.
4. Simulations With Batch Arrivals
The effect of batch arrivals was studied by simulations of an example building that had 20 upper floors with population of 60 persons, one entrance floor, and a group of six elevators serving all floors. The following elevator parameters were set: rated speed 3.5 m/s, acceleration 1.0 m/s2, jerk 1.6 m/s3, rated capacity 17 persons, door opening time 1.4 s, door closing time 3.1 s, photocell delay after the last passenger 0.9 s, and start delay 0.7 s. Conventional control system with up and down call buttons was used (Tyni and Ylinen 2001).
4.1 Validation with Up-Peak Traffic
The effect of passenger batches on the actual arrivals in the simulation was studied with two simulations. The first one was a simulation with individual arrivals but in the second simulation all the passengers arrived in batches of size two. In the former, average batch size was one while in the latter it was two, naturally. Figure 2 below shows the cumulative number of arrivals with respect to simulation time on the left and the distribution of passenger inter-arrival times on the right for both of these simulations.
The realizations follow the expected number of arrivals (the straight line), although vary around the expectation, which is the nature of a stochastic process. However, if all the batches are of size two, there are periods during which the cumulative number of arrivals increases abruptly within a short time and then remains rather stable for quite a long time; examples of such can be seen around 100, 200, and 250 seconds of simulation time.
The distributions of passenger inter-arrival times show clearly the difference between individual and batch arrivals. While batch arrivals produce inter-arrival times of 0 seconds, these are totally non-existent for individual arrivals. The number of such arrivals reflects the simulation settings: 50% of inter-arrival times equal zero in the simulation where all batches are of size two, i.e. the last passenger of the batch always has the same arrival time as the first one. On the other hand, the batch arrival process produces significantly more inter-arrival times of 15-30 seconds compared to the ordinary case of having only individual arrivals. These are properties of the compound Poisson process that describes passenger arrivals also in reality.
In another study, up-peak traffic was used to validate the simulation, i.e. whether simulation can reproduce the calculation results. First, up-peak equations (3)-(5) were applied to the example building with 80% car load factor. Calculated probable number of stops, highest reversal floor, round trip time, interval, and handling capacity are shown in Table 2 below for average batch sizes from one to two. Then, up-peak traffic was simulated for two hours. Each simulation was repeated 10 times with different random seed numbers. The arrival rates were equal to the calculated handling capacities in Table 2. The relative proportions of individual passengers and two-person batches were changed so that the average batch size varied between one and two passengers. Table 3 shows the averages of the repeated simulations as well as the standard deviations among them. The calculated and simulated number of stops and round trip times are compared in Figure 3.
Generally, average values of simulations follow quite well the theoretical ones. However, the simulation gives a bit shorter round trip times than calculations for average batch sizes below 1.5. The average car load factor remains steadily close to 80% even though the space in cars of rated capacity 17 persons is never fully utilized by two-person batches. It can be concluded that the simulation matches the up-peak calculation.
Both the calculations and the simulations show that the batch distribution has a significant effect on up-peak performance. As the average batch size increases, both the number of stops and round trip time decrease. This, on the other hand, means that handling capacity increases. As an extreme, if all passengers arrive in two-person batches instead of arriving individually, the number of stops is reduced by 40%, which also results in about 25% shorter round trip time.
4.2 Up-Peak and Lunch Hour Traffic with the Measured Batches
Up-peak and lunch hour traffic were simulated with both the individual and the batch arrivals. In these simulations, the batch-size distributions shown in Table 1 were used. The simulated up-peak traffic was pure, i.e. it consisted of 100% of incoming traffic. The lunch hour traffic was defined as 40% incoming, 40% outgoing, and 20% interfloor traffic. Simulation time was again two hours and the arrival rate was constant 12% of population in five minutes in all the simulations. Each simulation was repeated 10 times with different random seed numbers.
The total number of passengers generated during each two-hour simulation was 3456 persons. For the simulations with batch arrivals, Table 4 below shows the number of batches of different sizes as well as the number of passengers created from the batches. It is a straightforward calculation to ascertain that the distributions as a result of simulation are exactly the same as the measured ones. Thus, the batch arrival model of Building Traffic Simulator is valid also in this respect.
Table 5 shows average and standard deviation of the repeated simulations for car load factor, round trip time, waiting time, and time to destination. The effect of batch arrivals is rather small in up-peak, approximately 10% reduction including all reported parameters, as most of the passengers still travel alone. In the simulation of lunch hour traffic, the differences between individual and batch arrivals are substantial. Because of the batch arrivals the elevators make fewer stops, which reduces average car load factor and round trip time dramatically, by about 40%. Similar relative improvement is achieved also in passenger service level.
5. Summary
In this article, a study on the passenger arrival process in an office building was introduced. The results show that in the morning 10% and during lunch hour 30% of arrivals were batches of two or more persons. Even though the results are indicative, they give an idea of the importance of the phenomenon. The measurement covered only incoming traffic. The batch-size distributions of outgoing and interfloor traffic components probably differ from the one of incoming traffic so they also should be studied in detail later on.
The batches can be taken into account when calculating elevator round trip time and handling capacity in up-peak. The number of stops correlates with the proportion of the batches. The more there are batches, the fewer stops the elevators make during an up-trip. This reduces the round trip time and increases handling capacity. For instance, if all passengers would arrive in two-person batches instead of arriving individually, the probable number of stops in an up-trip would reduce by 40% and round trip time become 25% shorter. In the morning, however, people arrive to work mostly individually, and thus, the batch arrivals do not affect much the up-peak analysis. This means that the current up-peak analysis gives conservative and reliable results.
During lunch hour, however, people move more with their co-workers, clients or friends. The simulations with the measured batch distributions showed that the batch arrivals have an essential effect on elevator group performance. The car loading, round trip time, and passenger waiting times were reduced by 30-40% compared to individual arrivals. For office buildings, it is important to get the passenger arrival model as realistic as possible, especially for lunch hour traffic, since it strongly affects the predicted service level and the selection of the number of elevators in the building. The social factors causing people to form batches are likely to vary from one building to another and from one country to another. Therefore, a comprehensive set of buildings and cultures needs to be studied to find out general batch size distributions.

Figure 2. Cumulative number of arrivals (left) and inter-arrival time distributions (right) of simulations with individuals and two-person batches 
Figure 3. Number of stops per up-trip (left) and round trip time (right) 
Table 1. Batches at the entrance floors of an office building (Kuusinen et al. 2011) 
Table 2. Calculated up-peak parameters 
Table 3. Results of up-peak simulations 
Table 4. Number of batches and passengers in the simulations with batch arrivals 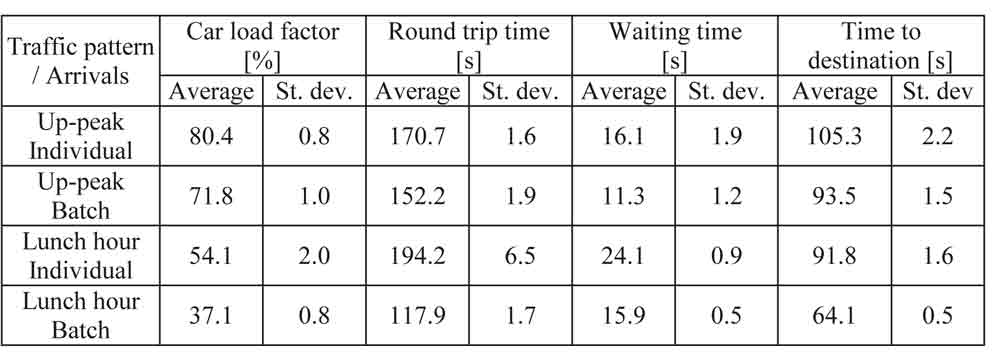
Table 5. Results of up-peak and lunch hour simulations with individual and batch arrivals
REFERENCES
Alexandris, N.A. (1977). Statistical models in lift systems. Ph.D. Thesis, University of Manchester Institute of Science and Technology. 252 pp.
Barney, G.C. (2003). Elevator Traffic Handbook: Theory and Practice. Spon Press, London and NewYork. 438 pp.
Barney, G.C. (2010). Traffic planning and selection of lift equipment and performance. In: CIBSE Guide D: 2010 Transportation systems in buildings, K. Butcher (Ed.). The Chartered Institution of Building Services Engineers, London, pp. 3-1 – 3-20.
Brown L., Gans N., Mandelbaum A., Sakov A., Shen H., Zeltyn S., Zhao L. (2005) Statistical analysis of a telephone call center: a queueing-science perspective. Journal of the American Statistical Association, Vol. 100 (469), pp. 36-50.
Gaver, D.P., Powell, B.A. (1971). Variability in Round-trip Times for an Elevator Car During Up-peak. Transportation Science, Vol. 5 (2), pp. 169-179.
Kuusinen, J-M., Sorsa, J. Siikonen, M-L., Ehtamo, H. (2011). A study on the arrival process of lift passengers in a multi-storey office building. Build-ing Services Engineering Research & Technology, November 10, 2011, doi: 10.1177/0143624411427459.
Peters, R. (1990). Lift traffic analysis: Formulae for the general case. Elevator World, Vol. 38 (12), pp. 30-31.
Peters, R. (2002). Current Technology and Future Developments in Elevator Simulation. International Journal of Elevator Engineers, Vol. 4 (2).
Roschier, N-R., Kaakinen, M. (1979). New formulae for elevator round trip calculation. Supplement to Elevator World for ACIST Members, pp. 189-197.
Ross, S.M. (1992). Applied probability models with optimization applications. Dover Publications, New York.
Siikonen, M-L. (1993). Elevator traffic simulation. Simulation, Vol. 61 (4), pp. 257-267.
Siikonen, M-L. (1997). Customer service in an elevator system during up-peak. Transportation Research Part B: Methodological, Vol. 31 (2), pp. 127-139.
Siikonen M-L., Susi T., Hakonen H. (2001). Passenger Traffic Flow Simulation in Tall Buildings. Elevator World, Vol. 49 (8), pp. 117-123.
Susi, T., Sorsa, J., Siikonen, M-L. (2005). Passenger Behavior in Elevator Simulation. Elevatori, Vol. 34 (5), pp. 28-37.
Tregenza, P. (1972). The prediction of passenger lift performance. Architectural Science Review, Vol. 15 (3), pp. 49-54.
Tyni, T., Ylinen, J. (2001). Genetic Algorithms in Elevator Car Routing Problem. In: Proceedings of the Genetic and Evolutionary Computation Confer-ence (GECCO-2001), Spector, L. et al. (Eds.). Morgan Kaufman Publishers, San Francisco, pp. 1413-1422.
Get more of Elevator World. Sign up for our free e-newsletter.


