Predicting Elevator Traffic Flow Using SAS
Jul 1, 2014

The Statistical Analysis System (SAS) software is used, and its results are verified with measured data.
by Xu Ruiying, Yao Lianghong, Yu Kun and Wan Jianru
High-rise and super-high-rise buildings have been trends of the construction industry in recent years. However, the problem of vertical traffic needs to be solved. Reasonable elevator selection and disposition play an important role in effectively using building area and reasonably distributing passenger flow. Because traffic-flow prediction is necessary for elevator selection and group-control simulation, the elevator traffic flow of buildings must be predicted accurately in order to achieve a reasonable selection of elevator configuration. So, it is very important to study elevator traffic flow prediction.[1]
This article analyzes the properties of elevator traffic flow then uses SAS software to predict elevator traffic flow. The Autoregressive Integrated Moving Average (ARIMA) modeling method is then used to build the prediction model of the traffic flow. The method is verified with the measured data of a Tianjin, China, building. Excellent prediction performance is exhibited by comparing the experimental and measured data. The simulation and experimental results show that the model can effectively predict elevator traffic flow. Finally, this paper provides an idea of elevator selection and disposition based on the study.
Elevator Traffic-Flow Analysis
Properties
Elevator traffic-flow analysis mostly depends on building type.[2] This study’s object is an office building. The elevator traffic-flow property of an office building appears relatively stationary, because people in office buildings usually work and rest regularly. This property makes it possible and necessary to analyze and predict traffic flow. Elevator traffic flow is described by the number, occurring period and distribution of passengers on each floor.[3] In practical analysis, only part of these data can reflect elevator traffic flow characteristics in a building. These include the number of passengers entering and leaving the entrance hall and total passenger flow in the building per 5-min. interval.
A group of data obtained within each interval is considered the elevator traffic-flow time series. Elevator traffic flow can be analyzed and predicted by all the methods used in a time series. The prediction process begins with researching condition, data and experience. After analysis and judgment, a model is built according to a theory and method. Then, results are verified, and this method is reused to resolve future problems.
Time-Series Properties
The traffic-flow time series needs to be preprocessed before building an elevator traffic-flow model. The method of modeling should be chosen after correctly judging the series property. Series preprocessing contains two important parts: stationary and pure randomness testing. Time series can be classified as different types, and different methods are used in different types.
Stationary Testing
The degree to which a time series is stationary is the premise of modeling. This attribute is commonly defined by characteristic statistics. The statistical properties of a time series are considered to be determined by its low-order matrix. So, if the low-order matrix of time series is stationary, the main property of the series can be guaranteed to be approximately stationary.
Judging the property according to sequence diagramming and autocorrelations are two main testing methods. Sequence diagramming of a stationary series shows the series randomly waving around a constant in a bounded range. If the series sequence diagram shows an obvious trend or periodicity, the series is usually not stationary. The degree to which it is stationary can be judged by an autocorrelations diagram, because a stationary series has the property of short-term correlation. Along with the rising of a lagging period, autocorrelation of a stationary series will quickly decrease to zero, while autocorrelation of a non-stationary series usually decreases slowly.
Pure Randomness Testing
It is also necessary to know that the sequence values have close correlation; thus, the prediction can be realized by mining effective information from historical data through modeling. If the sequence values have no correlation, the series is viewed as valueless in statistical analysis. To make sure the series is worth being analyzed, a pure randomness test should be taken, which usually constructs the test statistic “Ljung-Box.”
ARIMA Model
If the preprocessing of the elevator traffic-flow time series is found to be non stationary, smooth processing must first be carried out. Then, the performance should be analyzed in accordance with the stationary time-series model. The effective and common smoothing processing is the differential operational method. It is guaranteed, in theory, by Cramer’s decomposition theorem that the proper order of difference must be fully deterministic information extraction. For the non-stationary series that displayed stationary properties after difference, the ARIMA model is used for prediction. Modeling steps are as follows (Figure 1):
Obtain observing series.
Take the stationary test. If the result shows the series is stationary, take step 4; otherwise, take step 3.
Find the difference in the original series.
Make white-noise verification for the stationary series. If the result shows the series is a white-noise series, take step 6; otherwise, take step 5.
Fit the ARIMA model with the stationary and non-white-noise series.
End.
SAS Software Application
Introduction of SAS Software
In this paper, the model has built in SAS software, which has a special economic and time series module for analyzing economical and time series. Moreover, it has the advantage of a simple programming language, powerful output function and precise analysis result. The SAS system’s high data storage ability gives it an incomparable advantage in analyzing data.
Build Model in SAS Software
The ARIMA modeling method contains three stages: the model-identification, parameter-estimation/diagnostic-testing and predicting stages.[4] The ARIMA model in SAS is realized through the PROC ARIMA process. Its basic form is described as follows:
PROCARIMA DATA=time series dataset OUT=output forecasting dataset;
WHERE conditional expression: IDENTIFY VAR=variable(…)<option list>;
ESTIMATE<option list>;
FORECAST<option list>;
RUN;.
Application Case
Elevator traffic flow begins as a non-stationary time series, but it can become stationary after one order of difference. Thus, the ARIMA method can be used to model and fit elevator traffic flow.
In this article, the building passenger flow will be studied over 16 working days. Values examined are the total number of passengers in and out of the building per 5 min. from 7 a.m. to 7 p.m. One hundred forty-four data points were obtained (Figure 2).
To simplify the model, calculate the average values of the first 15 days according to a corresponding time point as the 16th series. The validity of the model involves fitting the average of the first 15 sets of data with predicting the 16th set.
| Name of Variable = x | |
| Mean of Working Series | 17.375 |
| Standard Deviation | 10.74572 |
| Number of Observations | 144 |
After inputting the average values into the program, we get several messages, through which the initialization of the program is completed:
- Obtain observed values, with the descriptive information of average traffic flow shown below (in this case, Table 1).
- Determine sequence stability: from observing the autocorrelation parameter values of average traffic flow, it can be found from the experiment results that the speed of autocorrelation coefficient reducing to zero is very slow. The autocorrelation coefficient is positive in the long delay period, then becomes negative. The time series of elevator traffic flow is proved to be made up of non-stationary sequences.
- The original series needs to be stabilized. Through observing autocorrelation values after difference, we can find that a series after one order of difference has strong self correlation, which basically corresponds with the stationary series’ property. So, the one-order-difference series can be regarded as the stationary series.
- Take the white-noise test for the stationary first-order differential sequence. According to the information of the white-noise test, when а equals 0.05, the statistical value P is less than а, indicating that the sequence is not a white-noise one.
- Fit the stationary and non-white-noise sequence of the ARIMA model after the first-order difference.
| Name of Variable = x | |
| Period(s) of Difference | 1 |
| Mean of Working Series | 0.006993 |
| Standard Deviation | 3.448921 |
| Number of Observations | 143 |
| Observation(s) eliminated by differencing | 1 |
Sequence values are then input to test the validity of the series and the degree to which it is stationary. Once the data is obtained, the ARIMA model can be fit and executed to obtain corresponding information and predict the result. After inputting the data into the modeling program, we get several messages:
- Differential sequence data is shown in Table 2.
- Through observing autocorrelation values after difference, we can find that the series after one order of difference has strong self correlation, which basically corresponds with the stationary series property. So, the one-order-difference series can be regarded as a stationary series.
- Determining the optimum order, corresponding information is shown in Table 3. Because the autocorrelation lag order and moving average lag order are all less than 5, appears in ARIMA(3,0). So, model AR(3) is chosen to build the model.
- After analyzing the information carefully and with the help of least-squares estimation theory, we can get the specific formula of the model that fits (Table 4).
- The model that fits is used to conduct a short-term prediction. The result is shown in Table 4.
| Minimum Information Criterion | ||||||
| Lags | MA 0 | MA 1 | MA 2 | MA 3 | MA 4 | MA 5 |
| AR0 | 2.13339 | 2.113725 | 2.144106 | 2.122676 | 2.137296 | 2.124878 |
| AR1 | 2.10653 | 2.116316 | 2.141462 | 2.127797 | 2.117082 | 2.08291 |
| AR2 | 2.12387 | 2.133658 | 2.165009 | 2.136327 | 2.12407 | 2.110371 |
| AR3 | 2.06032 | 2.086783 | 2.112496 | 2.118452 | 2.130692 | 2.119557 |
| AR4 | 2.07659 | 2.086591 | 2.109794 | 2.12566 | 2.157138 | 2.149176 |
| AR5 | 2.06745 | 2.070489 | 2.102424 | 2.117147 | 2.149279 | 2.183758 |
| Error series model: AR(16) | ||||||
| Minimum Table Value: BIC(3,0)=2.060321 |
| Forecasts for variable x | ||||
| Obs | Forecast | Standard Error | 95% Confidence | Limits |
| 145 | 2.2978 | 3.3267 | -4.2224 | 8.8180 |
| 146 | 2.1332 | 4.6150 | -6.9121 | 11.1785 |
| 147 | 1.9258 | 5.9233 | -9.6837 | 13.5353 |
The model fitting and forecasting curves are shown in Figure 3. From this, we can get that the forecasting traffic-flow data of the 16th day accurately fit the practical data, which verifies the validity of the ARIMA model in fitting and forecasting.
Finally, traffic flow of the new similar building can be predicted according to the historical elevator traffic-flow data of the interior building, providing the basis for reasonable selection and configuration of the elevators. The conveying efficiency of the elevators and area-utilization rate of the building are further improved.
Summary
The properties of the elevator traffic flow using the SAS program to realize the ARIMA model have been analyzed. The elevator traffic flow is also predicted with the help of this model. Validity and accuracy of the prediction model are verified by the prediction output graphics of test data.
Based on the study, it can be concluded that the valuable elevator traffic-flow data set can be obtained by the data-processing method of calculating the average in prediction of elevator traffic flow, and collecting and saving the traffic data of the constructed building. These data will be used to input into the ARIMA model in the prediction of elevator traffic flow. The forecast values combined with the practical building parameters can be used as the basis for elevator configuration.
Acknowledgement
This research was supported by General Administration of Quality Supervision, Inspection and Quarantine Nonprofit Industry Specialized Research Funding (No. 201310153).

Figure 1: A flowchart of a traffic-flow prediction model 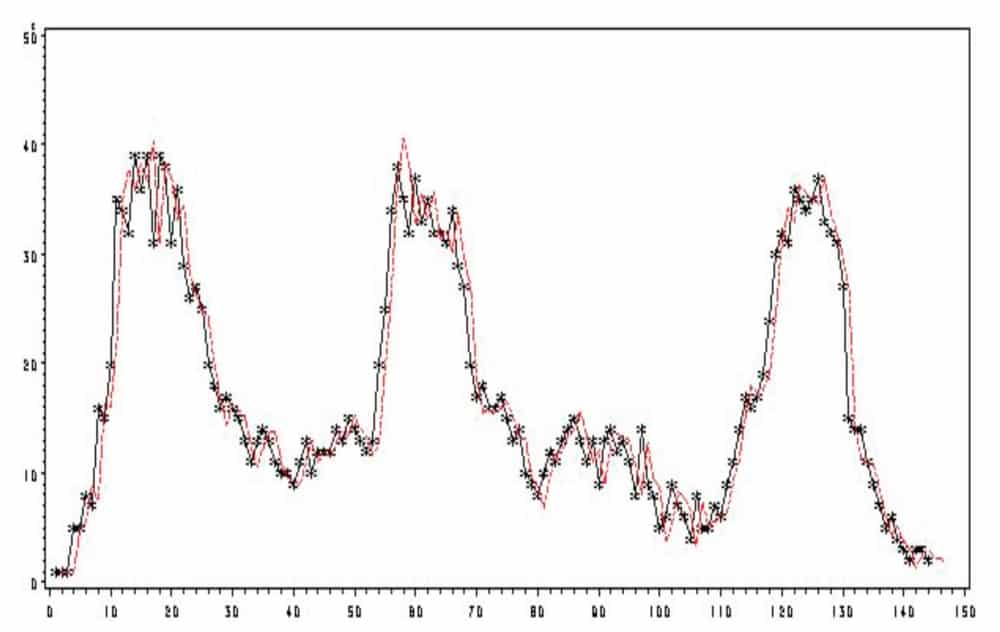
Figure 3: Model fitting and prediction curve: the line with asterisks represents practical value, and the normal line stands for forecasting value.
References
[1] Jianru, Wan and Yuefeng, Yang. “Research on Elevator Model Selection and Configuration and Optimization Design,” China Elevator, 2009, 20(19).
[2] Barney, G.C.; dos Santos, S.M. Elevator Traffic Analysis, Design and Control. London: IEE Peter Peregrinus, 1985.
[3] Huang, Min; Baotong, Cui; and Shusheng, Gu. “Forecast of Elevator Traffic Flow Based on Wavelet Neural Network Theory,” Control and Decision, 2006, 21(5): 589-592.
[4] Dewen Zhu. “Statistical and Dynamic Properties of Elevator Traffic.” China Elevator, 2003, 14(4): 23-27.
Get more of Elevator World. Sign up for our free e-newsletter.