Predictive Maintenance — Smart Services Enabled by Industrial Analytics
Oct 1, 2018

by Rami Aro and Carlos Paiz Gatica
This paper was presented at  Berlin 2018, the International Congress on Vertical Transportation Technologies, and first published in IAEE book Elevator Technology 22, edited by A. Lustig. It is a reprint with permission from the International Association of Elevator Engineers
  (www.elevcon.com).
Words like “smart elevator,” “big data,” “predictive maintenance,” etc., are currently inspiring many elevator and escalator manufacturers. Based on predictive maintenance, guaranteed machine uptime is projected to deliver added value to new systems. But, more and more companies are realizing that the expansion of data-based services provides them with a real business advantage, and such futureproof business models are set to leverage long-term customer loyalty. The methods employed by industrial analytics help to achieve this. Machine learning and artificial-intelligence techniques allow machine behaviors of an elevator or escalator to be better understood by the manufacturer, thereby revealing structures and patterns and providing new insight into data relationships. But, the path to go needs to be a well-organized process. Weidmüller shows how to describe the use case and establish a proof of concept, while the project team runs through the traditional stages of data capture, integration, preparation, analysis, implementation and, finally, evaluation of the economic benefit.
Introduction
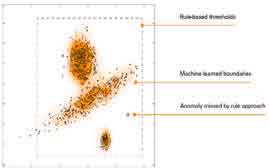
Technological development of automation systems toward digitalization brings many advantages and opportunities, such as flexibility, economic production of small lot sizes and optimization of production processes. Besides that, there are also big challenges to increase equipment reliability and uptime, especially for elevator and escalator companies. A further challenge is the realization of more efficient maintenance strategies, while reducing costs. Nowadays, rule-based monitoring systems are well established among elevator systems, mainly because of the simplicity of such an approach, where boundaries for individual signals (e.g., sensor values) are set up by application experts. If, for example, a motor needs to be monitored, limit values for specific fault indicators are defined (e.g., temperature, current consumption). If any of the monitored signals goes beyond the defined boundaries, an alarm can be generated. For simple applications, rule-based approaches are well suited. However, if, for the application at hand, dynamic transitions of many signals are relevant for fault detection, this task becomes too complex for a rule-based approach. Furthermore, changes in the signal behavior, which occur between the boundaries defined by rule-based monitoring systems, are not detectable (Figure 1).
A model-based approach can be used to improve the performance of a monitoring system. A model can represent several dimensions simultaneously so that machine states are well identifiable. The development of an adequate model can be very demanding and requires highly skilled human resources. However, by using industrial analytics methods (e.g., machine learning algorithms) and process data to derive a machine model, the complexity of the implementation of a monitoring function can be significantly reduced.[1] Furthermore, the monitoring quality is improved, as more complex faults, which are not identifiable with a rule-based system, can be detected.
This article is organized as follows: the typical workflow of an industrial analytics function and the topology for the realization of industrial analytics functions. The next section explains the typical phases of an analytics project, based on offline analysis and online analytics. A conclusion follows.
Industrial Analytics Workflow
Industrial analytics functions are typically composed of different tasks (Figure 2). The figure shows the typical workflow of an industrial analytics application, where data from the different devices are first consolidated in a single data source (data storage). The next step is to pre-process the data as preparation for the learning process (pre-processing). In this step, relevant features are extracted from the raw data signals, involving the combination of statistical methods with domain knowledge to select meaningful features.
The next step is the selection, training and tuning of machine learning algorithms to derive a model from the selected features (model learning). Again, the combination of analytics expertise and domain knowledge is key to developing an efficient model. Once developed, the model can be used at runtime to monitor the machine or process (model execution). To be useful, the results need to be properly visualized (visualization). The kind of visualization should be selected according to the role of the person who shall use this information, such as the building owner, the facility or maintenance manager, etc. The integration of an industrial analytics function in an automation system can be done at different levels: for instance, at the machine or using a cloud platform. These possibilities are explored in the next section.
Topology for the Realization of Industrial Analytics
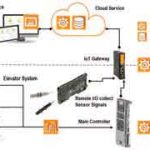
The realization of the basic operations of the analytics function (data storage, pre-processing, model learning, model scoring and visualization) can be done at different levels, e.g., to collect data at the component level (drive, car, doors) and at the field level, e.g., using a sensor kit and collecting signals with a remote input/ output system. Since data sources can be heterogeneous, there is the requirement to transform the data into a unified format for further analytics processing. Depending on the given application and prerequisites of the user application, data can be stored either locally on the premises, e.g., by using the main controller or an Internet of Things (IoT) gateway or in the cloud using suitable storage cloud services (Figure 3). The analytics processing can be performed on various devices or platforms or by using software as a service in cloud platforms. While automation components are primarily used for process control, they might qualify for implementing analytics processing functionality if a suitable amount of resources is left.
Besides the given hardware resources, processing and memory requirements vary according to the task to be performed. Especially, deriving a machine model often requires significantly more resources than executing that model. There are various architectural options for storing and processing data, and the selected implementation is subject to constraints, such as the given architecture, processing needs, data rates and storage complexity. There is a need for flexibility in the realization of analytics functions to address the various industry applications. For elevator applications, data sets are mainly generated from the controller in real time. The applied algorithms need to show low latency, and the data sets are typically of small volume and are highly correlated to each other. Therefore, an implementation of industrial analytics functions using edge devices (e.g., an IoT gateway) can bring many advantages, such as short reaction times and decreasing network traffic.
Typical Phases of an Analytics Project
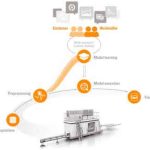
The path to go for an analytics project needs to be a well-organized workflow of typically five phases (Figure 4). At the beginning stands the problem analysis and target definition; e.g., which particular failures should be predictable. During the phase of data exploration, the quality of the generated data will be verified to determine if the defined faults can be detected, or more data quality is needed. During proof of concept, the technical and economic proof of feasibility will be checked (offline analysis). In the pilot phase, a functional prototype will run on a pilot application (online analytics). Finally, in the last phase, the pilot-proofed analytics solutions will be developed and deployed.
Offline Analysis
Applying data analytics on machine data typically starts with its offline exploration. Sample data from a few machines for a selected representative timeframe are retrieved and then analyzed offline by data scientists. They explore the data by applying various data analytics methods to find out which methods provide the best actionable insights. Companies that offer such services differentiate themselves by their ability to perform offline analytics in an efficient way. Over time, we at Weidmüller have built an extensive data science and machine-learning toolbox that allows assessing sample data in a short time.
Online Analytics for Predictive Maintenance
For the purposes of predictive maintenance, the machine data needs to be continuously monitored. The machine state is assessed from the acquired data, and abnormal events and failure indicators are detected and used to identify required maintenance. Then, recommendations for maintenance activities are provided to the building owner and facility or maintenance managers. Depending on the nature of the physical conditions that lead to machine failures, it may be necessary to process data in near-real-time with subsecond latency on the one side, or in a daily or weekly test on the other end of the spectrum. Online analytics systems should be flexible to handle this variety of timing requirements.
We currently consider three different categories of analytics that generate information for machine monitoring and predictive maintenance systems: direct calculations, machine state and activity recognition, and anomaly detection.
Direct calculations take sensor data from a machine as input and compute, for example, the wear of a machine part.
Machine state recognition algorithms as input consume machine sensor readings or process data to identify the state of the machine at a given point. We use machine learning technologies to classify machine states and machine activities based on models learned in a designated training phase before.[2] The obtained machine states and activities are useful for predictive maintenance when further processing and reasoning is performed.
Anomaly detection[3] is another very helpful technique for finding failure indicators and assessing maintenance needs. When in normal operation, the sensor signals usually lie within certain value ranges or exhibit particular normal patterns. Obviously, we are interested in capturing deviation from normal behavior. A single detected anomaly can already be indicative of a failure and used to trigger an action. Often, it is the case that a single anomaly is actually not sufficient, and only an increasing number of anomalies over the course of time will provide sufficient indication that the machine is not working optimally or is developing a condition that needs to be addressed by personnel. Furthermore, there are many reasons why anomalies can be detected in machinery sensor data, and plenty of these might actually not be related to any problems but are caused by other influence factors. For instance, operator interaction or a change of parameter settings can have an impact on the sensor measurements. An important feature of a predictive maintenance solution is to understand the context of measurements and to assess which anomalies are relevant to predict maintenance needs.
Conclusion
We have outlined the workflow and topology for industrial analytics functions and described the five phases of a typical analytics project. The offline and online approach to realize predictive maintenance were discussed, showing the key advantage of combining data science with domain specific knowhow.
Machine data generated from elevators and escalators, combined with data from the maintenance organization, are turned into powerful insights when industrial analytics functions are applied. These data can turn into actionable outcome, like predictive maintenance — e.g., to predictively identify, analyze and resolve possible service issues before they occur. This, finally, results in the reduction or elimination of downtime.
Weidmüller can partner in the joint realization of industrial analytics solutions, step-by-step from the idea to scalable, smart services, and in the development of data-driven business models. Tailored analytics solutions that deliver the best possible performance for the costumer’s needs are provided. We act independent of platform and can realize on-premises, cloud or hybrid deployment, regardless of specific cloud platforms. Our analytics solutions work independent of vendor, regardless of the underlying automation or control system.
- Figure 1: Rule-based monitoring versus model-based approach
- Figure 2: Typical workflow of an industrial analytics application
- Figure 3: Possible topology to collect data at component and field levels
- Predictive-Maintenance-Smart-Services-Enabled-by-Industrial-Analytics-Figure-3
References
[1] Maier, Alexander, Köster, Markus, Gatica, Carlos Paiz, and Niggemann. Oliver. “Automated Generation of Timing Models in Distributed Production Plants,” IEEE International Conference on Industrial Technology (ICIT 2013), Cape Town, South Africa, 2013.
[2] Liao, T. Warren. “Clustering of time series data
— a survey,” Pattern Recognition, Vol. 38, No. 11 (November 2005), p. 1,857-1,874.
[3] Chandola, Varun, Banerjee, Arindam and Kumar, Vipin. “Anomaly Detection: A Survey,” ACM Computing Surveys. Vol. 41, No. 3, Article 15 ( July 2009), 58 pa.
Get more of Elevator World. Sign up for our free e-newsletter.


