Those who read Herres’ two-part Continuing Education series on Oscilloscopes (ELEVATOR WORLD, May and June 2016) may be interested in purchasing one of these instruments. In this review, Herres writes about his recommendation. . . . Editor
The big-three oscilloscope makers, Tektronix, LeCroy and Keysight (formerly Agilent) manufacture high-end instruments that have advanced features, astronomical specifications, specialized controls and highly readable displays. The prices for the high-bandwidth, four-channel oscilloscopes are in the multi-thousand-U.S.-dollar range, making them suitable for the well-equipped laboratory, product developer or university with an adequate budget.
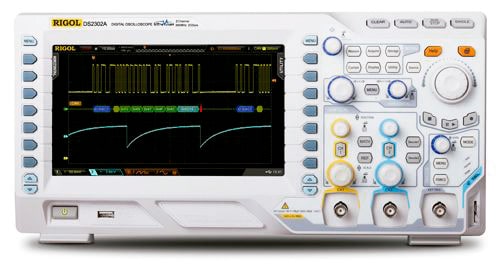
The independent technician or serious student who requires a quality bench-type oscilloscope at a modest price is forced by the realities of the instrumentation market to look at alternatives. Foremost among them is Rigol. This manufacturer offers a range of models, including the DS2102 oscilloscope, which can be purchased from Amazon for just under US$1,000. The question is whether this instrument is satisfactory for everyday use in regard to quality of workmanship, reliability, specifications and included features.
Your author has been using an advanced four-channel Tektronix oscilloscope with 1-GHz bandwidth and 5-GS/s sampling rate, fully loaded with all available options. However, for the past few weeks, he has also been using a Rigol DS2102. The following are his findings.
The Rigol is somewhat smaller and lighter than its competitors, but its construction and workmanship appear to be superb. The enclosure and controls are well made, and the screen, measuring 7-3/4-in. diagonally (as opposed to the 9 in. of the Tektronix) is absolutely readable and adequate for bench work. Checking online tech forums, etc. does not indicate a problem with the Rigol’s long-term reliability.
The reason for the much lower price is reduced specifications. At 100 MHz, you need to ask if this is adequate for the work you will be doing. At higher frequencies, the parallel capacitive reactance decreases, shunting out the signal, and the series inductive reactance increases, also making for a rise in attenuation. To manufacture higher-bandwidth instruments, very tight internal tolerances and exacting terminations, as well as special semiconductors, are needed, and these are what set the stage for increased pricing. For general motor work, including variable-frequency drive (VFD) troubleshooting and power-quality measurements, likely areas for elevator technicians, the 100-MHz limit does not present a problem. Another reason for the more modest price tag on the Rigol is the fact that it has two analog input channels, rather than four. So, again, you have to ask whether your anticipated work will entail viewing more than two signals simultaneously.
Finally, we have to examine the features that the Rigol DS2102 offers. The simple answer is that they are extensive. An example is the “Math” capability. Like the “Big Three,” Rigol permits users to access quite a variety of information concerning two separate signals by means of this feature. (In this mode, some analytics pertain to only a single signal.) To show how this works, we can input two separate signals into the two channels. These could be 60-Hz utility power from a premises branch circuit and DC from a 9-V battery. Then, first press the “Math” button, followed by the softkey that corresponds to “Math.” Two alternatives are displayed — “Off” and “Operate,” which is highlighted. Press the softkey again, and “A + B” is activated. The sources are listed. Source A is Channel 1; Source B is Channel 2. Each waveform is displayed in the characteristic color for the respective channel. The result is shown in purple, which is not a dedicated channel color; it is a waveform that depicts the sum on an instant-by-instant basis of Source A and Source B.
Pressing the Softkey twice, once to activate the menu and again to scroll down, we see “A – B” displayed in purple. This time, the result is the difference between Source A and Source B, again on an instant-by-instant basis. Scrolling down once more, the product is displayed. An interesting and informative exercise in the multiply mode is to display a voltage as source A and, using a current probe, hook onto the same signal and display it as Source B. The result will be a measure of power in the circuit.
Again scrolling down, Source A is divided by Source B. In some instances, if an attempt to divide by zero is made, the result may look strange. As always, if a display appears inappropriate or if there is no display, press “Auto.” This reconfigures triggering and amplitude for the signal of interest.
Press the softkey once again to access the next operation. It should correspond to “FFT,” which stands for “Fast Fourier Transform.” This is a modern reworking (definitively formulated in 1960) of Joseph Fourier’s Fourier Transform, which he developed in the 19th century in connection with heat transfer. It decomposes a function of time, the signal, into the frequencies that comprise it. This is particularly applicable to electrical signal waveforms as displayed in an oscilloscope. The mathematics are very difficult, but the modern oscilloscope does it with a couple clicks of a button.
Here, the operation is relevant to a single source (not two), which is listed as Channel 1. Pressing the second softkey from the top, we can toggle between Channel 1 and Channel 2 as the source. Going into “FFT,” the display becomes a split screen. The top half depicts the waveform in original time-domain form. The bottom half displays the signal from the selected channel in the frequency domain.
This is the same signal, with no information gained or lost. To emphasize, time domain and frequency domain are different representations of the same electrical signal, and it is possible to translate any number of times in both directions with no distortion or loss of information.
In the frequency domain, the Y axis still depicts amplitude, but rather than in volts, it is shown in power on a logarithmic decibel scale. The X axis, rather than time, represents frequency. Notice that, in the frequency domain for both the sine wave and the DC signal, there is a single large spike at the fundamental, with no significant portion of the power shown in the form of harmonics. For a square wave, with very fast rise time and decay, it would be quite a different story with a smaller portion of the energy at the fundamental and harmonics showing up at other frequencies, diminishing in amplitude as the difference in frequency from the fundamental increases. Modern oscilloscopes, including the Rigol DS2102, illustrate this relationship very clearly.
The frequency domain is very useful for showing details regarding a signal that may be missed when looking at it exclusively in the time domain. For example, when examining the power supplied to a VFD connected to an elevator motor that has been overheating, it is recommended to look at the power quality to see what, if any, proportion of the power is expressing as harmful harmonics, as opposed to being concentrated in the fundamental. Such distortion may be caused by other connected non-lineal loads within the facility or in the vicinity. Also, cabling or termination problems can be seen in the frequency-domain representation.
In the Rigol DS2102, “Math” mode has other capabilities applicable to various digital signals that may originate in a motion controller and be connected to the inverter section of a VFD. These are “Digital Filter,” “Logic” and “Advanced.” The device has numerous other capabilities typical of more expensive machines. These include “Record,” “Measure” and “Storage,” among others:
- Recording is performed using the odd-shaped button under the large dial at the right of the front panel. It has a solid circle symbol, and the backlight is red. Press this button to begin recording a waveform, entering it into the oscilloscope memory. The button on the left stops the recording. The button in the middle pauses and plays back the recording.
- “Measure” includes three modes: “Math Operation” (discussed above), “Auto Measurement” and “Cursor Measurement.” “Auto Measurement” measures 24 waveform parameters and includes statistics and analysis. Additionally, the frequency counter provides an exact documentation of the frequency of any AC signal. “Cursor Measurement” permits the user to place vertical and horizontal marks along the X and Y axes. The cursor positions can be adjusted — for example, to bracket peak-to-peak voltage levels or time intervals. Measurements are displayed onscreen as numerals.
- “Storage” permits the user to record settings or waveforms in internal memory or in a flash drive inserted into the USB slot. To execute the saving action in a USB device, first highlight and select “Disc D,” then press the button marked with the image of a printer. The USB device can then be removed from the oscilloscope and inserted in a computer’s USB slot. The waveform and/or settings can be saved as a jpeg or another format in the computer for later reference, and can be printed or emailed to a colleague.At the modest price, within bandwidth limitations, the Rigol DS2102 is a competent instrument with extensive capabilities and an intuitive human interface. It will serve the student or independent technician well for many years down the road.
Get more of Elevator World. Sign up for our free e-newsletter.


