The Story of People Flow in Cities
Feb 28, 2022

KONE data looks at the impact of the pandemic on people flow in workplaces, hotels and more.
submitted by KONE
photos courtesy of Financial Times Commercial department
KONE, a global leader in the elevator and escalator industry, has analysed data from its global elevator portfolio to tell the story of the flow of people in cities around the world over the course of the COVID-19 pandemic.
The data collected covers the period from before the first lockdowns confined most populations to their homes to the present day, and provides an original data set for illustrating the return of people to workplaces, educational institutions, hotels and residential buildings.
Equipment designed and manufactured by KONE moves more than 1 billion people every day in its customers’ buildings. Here are some highlights from the data collected:
- In the top 10 European cities, the average number of elevator journeys plummeted 80% between February and April 2020.
- The return to office buildings in Paris, Munich, Helsinki, Berlin, Milan and Hamburg remained at 60% of pre-pandemic levels during 2021.
- The return to the office slowed again in November and December 2021 with the discovery of a new COVID-19 variant in the second half of the month.
Office Elevator Use in London Dropped 80% at the Height of the Pandemic
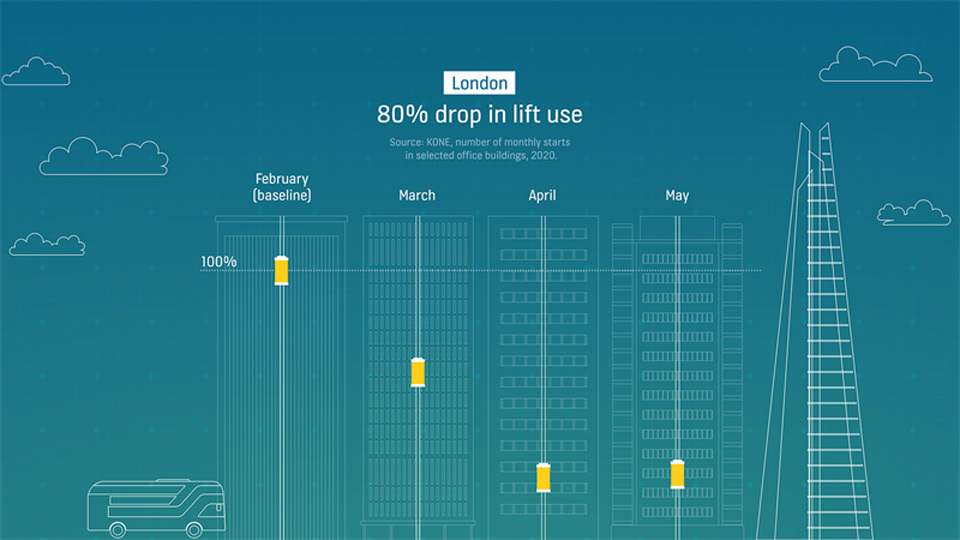
The data shows that in the top 10 European cities where KONE has comprehensive elevator data showing the movement of people, the average number of office elevator journeys plummeted by 80% between February and April 2020.
In London, the average number of starts per elevator in September 2019, before the pandemic, was around 13,000 in office buildings. By April 2020, the average number of journeys per elevator had fallen to around 2,500.
In Amsterdam, the average number of starts per elevator in office buildings in September 2019 was around 16,500. By April 2020, the monthly average number of journeys had fallen to under 3,500 per elevator.
In the figures for November 2021, elevator use in London had rebounded to 72% of pre-pandemic levels, with the average KONE elevator making around 9,200 journeys in offices in November. In December, this number dropped again to 6,250.
However, the rate of increase of elevator usage in Europe stalled, or even fell, between October and December, potentially reflecting the change in people’s behaviour or new restrictions on movement in response to the discovery on the Omicron variant in the second half of November.
For instance, in Amsterdam, the average number of journeys per office elevator was just under 9,000 in October, but fell to 7,900 in November and then 5,600 in December.
Other European cities in the top 10 of KONE’s portfolio — Berlin, Brussels, Hamburg, Helsinki, Milan, Munich, Paris and Stockholm — have all seen steady rises in office elevator use since the depths of the first lockdown, though the return to office buildings in all of them has abated or fallen since October.
Hotel Sector’s Recovery Reversed at the End of 2021
The data for hotel elevators tells the dramatic story of the pandemic. In London, from a monthly peak of more than 22,000 starts per hotel elevator in September 2019, this number plummeted almost 90% to around 2,500 starts per hotel elevator by April 2020.
Although the monthly number of average journeys per hotel elevator in London recovered to around 19,000 in October 2021, this number fell to under 18,000 in November and under 16,000 in December.
This fall in hotel elevator usage has been replicated in Amsterdam, Stockholm, Berlin, Paris, Hamburg and Munich.
The Global Picture Shows National Differences When It Comes to the Return to the Office
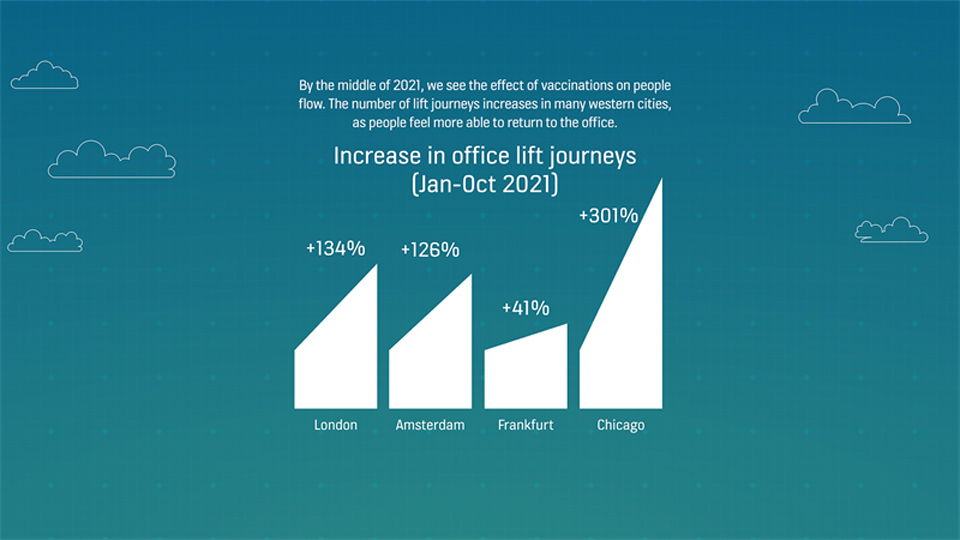
Since January 2021, a more nuanced picture has emerged from KONE’s elevator data for office buildings, which reflects different COVID-19 strategies in individual countries.
For example, in Shanghai at the start of the year, when China’s workforce had largely returned to typical working patterns, the monthly average number of starts per elevator stood at 18,300, but as of October, the average number of monthly journeys had dropped to fewer than 15,000. This number grew again to mid-17,000 in November and December.
Whereas in Chicago, which still had strict restrictions in place at the start of this year, elevator usage has grown slowly and steadily since January, reflecting the U.S.’ systematic approach to managing the pandemic, and people feeling safer to return to the office. This number saw slight dips in November and December.


Tessina Czerwinski, program director, Smart and Sustainable Cities at KONE, commented:
“The number of people living in cities is predicted to rise from 4 billion today to more than 6 billion by 2050. We need to accommodate and help all these people move around in cities in a sustainable way. Technology enables us to create personalised, even safer ways to connect people and places. Elevator data can teach us a lot about how life has changed over the past couple of years — and it can also teach us how life might change in the future.
“Throughout the pandemic, though, one of the principal variables has been the specific national coronavirus restrictions at a particular moment in time, which is where we start to see different cities navigating different journeys through the crisis. For instance, at the start of 2021, the U.S., Europe and China were at completely different COVID recovery stages with different rules on the movement of people, which is reflected in the way people have been traveling up and down office, hotel, educational and residential buildings this year.”
Contact [email protected] for more information.
Get more of Elevator World. Sign up for our free e-newsletter.


