The Studies in Europe and the Energy Efficiency Guideline VDI 4707
Aug 1, 2011

VDI has developed a voluntary guideline that defines energy measurement procedures and an energy-efficiency label showing the relevant energy figures in an easy-to-understand manner.
This paper was presented at  Lucerne 2010, the International Congress on Vertical Transportation Technologies and first published in IAEE book Elevator Technology 18, edited by A. Lustig. It is a reprint with permission from the International Association of Elevator Engineers
  (website: www.elevcon.com). This paper is an exact reprint and has not been edited by ELEVATOR WORLD.
Key Words: Energy, efficiency, standby, VDI 4707
Abstract
The trend towards sustainability and energy efficiency does not stop when it comes to elevators. The study by the Swiss federal office of energy in 2005 took a pioneer role in the energy consumption research of elevators. Within the European Commission’s Intelligent Energy Europe Pro-gramme, the Energy-Efficient Elevators and Escalators project followed up the research.
Considering all the work available, the association of German engineers VDI has developed a voluntary guideline that defines energy measurement procedures and an energy efficiency label showing the relevant energy figures in an easily understandable manner.
1.Introduction
Global warming and its environ-mental impact is one of the major topics that we face today. People want to be aware of the cause, understand the situation, identify the major polluters and finally act to improve.
In 2005 as a consequence, elevators got into the focus of the Swiss federal institute of energy. After some discussion, it got decided that a research project has to be started to measure elevators in Switzerland and estimate the energy used by all installed elevators.
Following the work done in Switzerland, the Energy-Efficient Elevators and Escalators project supported by the European Commission’s Intelligent Energy Europe Pro-gramme, identified in 2010 the energy demand of elevators and escalators in Europe and its saving potential.
The association of German engineers VDI, published in 2009 a guideline to assess the energy efficiency of elevators. This guideline defines an energy label for elevators similar as known from other devices. It there-fore identifies key figures such as standby demand and estimates a nominal yearly energy demand figure for an elevator.
2.Main Body
The first question someone might ask is: How much energy uses my elevator per year? The only way to answer this question would be, attach an energy counter to the elevator and measure the energy consumed after one year. Then the answer could be: Last year your elevator used 830 kWh. With the energy price of €0.15 per kWh electricity; this results in€124.50. Next year it will be probably the same.
This approach is obviously not practical to get a quick answer and can be used just for already installed elevators with known traffic patterns. Maybe in the future, elevators could be equipped with individual energy meters, but this would take years until it could be realized.
Therefore methods had to be in-vented to assess energy demands of elevators. Those methods need to be practical. Practical means, it should be possible to perform an energy measurement in a one to two hour intervention on an individual customer elevator. Obviously it is not very practical to bring a couple of tons load to the customer site to perform measurements with a loaded elevator car. Luckily, due to the counter weight balancing on most elevators, a trip with an empty car, results in an extreme situation for the drive system and this situation can be used to analyze the energy per-formance. However special balanced elevators may re-quire a loaded car to measure such extreme situations for the drive system.
Knowing how the elevator performs during single trips and making an assumption about expected traffic, it is possible to make yearly energy estimates.
Obviously those estimates can not be as precise as measuring the energy consumption of an elevator during a long period. However in most cases energy estimates are the only possible ways to give energy statements.
The study by the Swiss federal office of energy, the re-search project Energy-Efficient Elevators and Escalators, the VDI guideline and the work done in ISO/TC178 Lifts, escalators and moving walks (WG10 Energy efficiency) came all to the same conclusion that two key figures need to be defined:
- Energy for a reference trip
- Power used when standing still (Standby)
On installed elevators those two key figures can be verified by measurements.
For the reference trip, the energy will be measured while the empty car travels from the lowest floor to the top most floor and back.
Standby power is measured when the elevator is standing still. However a lot got discussed when and how this is measured. Taking a closer look shows that the standby power value is not constant: Elevators turn off the car light, the fans, remove force from the doors, charge emergency batteries, stop to have the dc link of the drives frequency converter charged, ….
Instead of considering every single effect and miss some unknown effects, it is more practical to measure the standby power value some minutes after a finished trip.
3.Results
Around 100 elevators have been measured in the two public studies so far. The following data comes from a 630kg, 1m/s modernized traction elevator serving 5 floors in a school house with a rise of 12.6m.
The power curve shows a reference trip from the lowest floor up to the top most and back.
Since the car is empty, the down trip has to lift the counterweight and uses up to 6kW. Power analyzers are the preferred instruments to measure such power curves with high dynamic power changes and currents that are not sinusoidal. If not adequate equipment is used, the measurement effort has no value, since the fundamental idea behind measurements is the following: When differ-ent people using different instruments measure the same elevator, all have to end up with almost identical values.
Energy is power over time, so the recorded power curve can be integrated to get an energy curve:
The energy used for this 67 second round trip is 22Wh. Assuming the price of €0.15 per kWh electricity; such a reference trip in a residential European building costs€0.0033. This shows that taking the stairs instead of the elevator, does not save a lot of energy.
EN81 elevators have also a main switch for car lighting and depending circuits. During the reference trip, the power value measured at this point is constantly 96W, since this value manly result from the car light. Considering the 67 second trip time, 1.8Wh additional energy is used in this circuit during the reference trip.
120W standby power on the main switch of the power circuit has been measured 5 minutes after the last trip. If the elevator is equipped with traditional lighting, the car light will still be turned on 5min after a trip and adding additionally 96W to the standby power. Unfortunately the studies in Europe showed, many elevators have the car lights turned on for 24 hours a day.
Switching the car light immediately off, would save energy, but would significantly reduce lifetime of the lamps (incandescent or florescent) and therefore have a negative impact in the overall environmental life cycle assessment of an elevator.
Common values to turn off the car light are in the area of 15 to 30 minutes. This parameter can easily be modified in the controller software, but requires detailed product knowledge and maybe even a special tool. People performing the energy measurements do not have this detailed product know how and would have to wait for an unknown time until the car light eventually turns off. Often and especially single elevators in residential buildings can not be taken out of service for a long time. Therefore the definition to measure standby 5min after the last trip is practical. This uncertainty in the behavior of the car light and for the standby values in general, leads to higher standby figures. Since the energy calculations are using those figures, they will produce a pessimistic result.
Luckily, new technologies bring new solutions that allow switching off the car light as often as desired. Such technologies are: LED’s and compact fluorescent lamps with heavy duty switching durability.
4. Discussion
The next step is: Take the figures from the measured single trips and use them to make the yearly energy estimate of the elevator. Again the yearly energy used by elevators can be divided into two parts:
- Energy used to move the car
- Energy used for standing still (Standby-Energy)
To estimate the energy used to move the car, the energy measurements of the reference trip have to be taken.
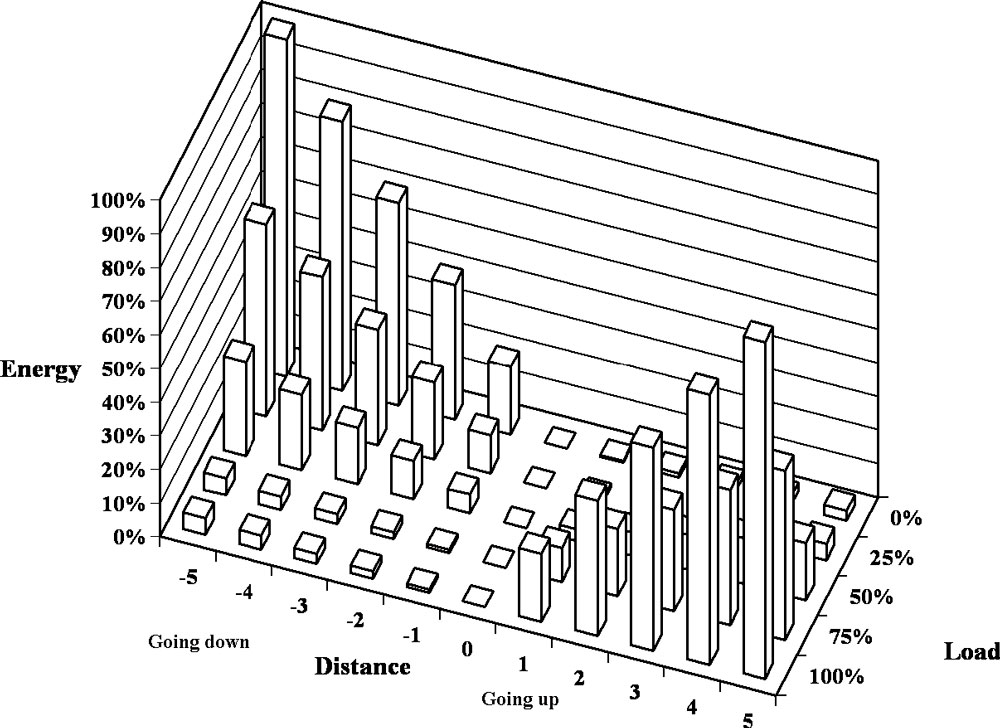
In the simplest case a reference trip with an empty car of a 50% balanced traction elevator can be measured. Since often no other measurements with different load and travel distance exist, assumptions and interpolations have to be made. The following figure illustrates the assump-tions to get a simple mathematical model:
- The energy for a reference trip is used just to lift the counterweight (Point 1).
- Lowering the counterweight requires no energy (Point 2).
For regenerative drive systems a negative value could be considered.
- A balanced car does not use energy to move (Point 3)
- A full loaded car uses the same energy for a reference trip as an empty car (Point 4 and 5).
- The other load conditions and travel distances can be linear interpolated.
To compare how accurate the simplified model is, more measurements with different load conditions and travel distances could be made. Theoretical every load condition and every travel distance could be measured and put into a matrix.
The energy to move from floor to floor might even depend on the specific floors. For a single load condition a matrix could be created:
Even doing all this effort, the biggest uncertainty to estimate the yearly energy still remains. It is how passengers use the elevator. The proposed simplified model is there-fore a good compromise between effort and accuracy.
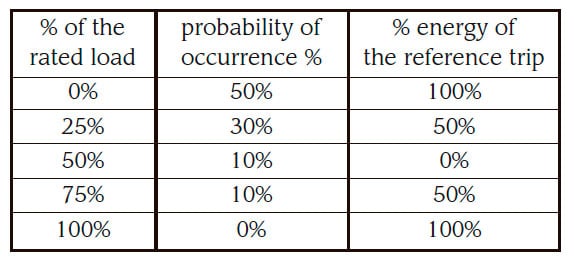
The average trip uses average load in the car and travels an average distance. For a European residential 50% balanced traction elevator a simple traffic pattern can be assumed:
The average round trip (up trip and down trip = two trips) uses therefore:
100% * 50% + 50% * 30% + 50% * 10% = 70% energy of the reference trip.
For single elevators in European residential buildings the average travel distance can be considered as half the rise.
Since the reference trip contains two trips and the aver-age trip distance is half the rise, the energy used for an average trip is 1/4 of the energy of average round trip.
The yearly energy demand of a 50% balanced traction elevator can be estimated according the formula:
Etravel = 1/4 n * Ereftrip * 0.7 . . . . . . . . . . . . . . .(1)
- Etravel = yearlyenergy to travel
- Ereftrip = energy used for the reference trip
- n = number of trips per year
The standby energy demand can be calculated as follows:
Estby = Pstby * tstby . . . . . . . . . . . . . . . . . . . . . . .(2)
tstby = 365days * (24hours – ttravel) . . . . . . . . . .(3)
- Estby = yearly energy for the standby
- Pstby = standby power
- ttravel = time during the year when the elevator travels
- tstby = time during the year when the elevator stands still
5. Conclusions
The studies in Switzerland, in the European Union and VDI 4707 used similar mathematical models to estimate the energy demand of the elevators.
The 2005 estimates for Switzerland showed that the approximately 150,000 lift systems in Switzerland consume around 300GWh per year, which is equivalent to 0.5% of the country’s electricity demand. Surprising was, that more than 50% of the energy got used just for standby. Often new elevators have more standby power than old ones. New elevators have a lot of standby consuming electronics to comply with today’s safety, accessibility and comfort requirements.
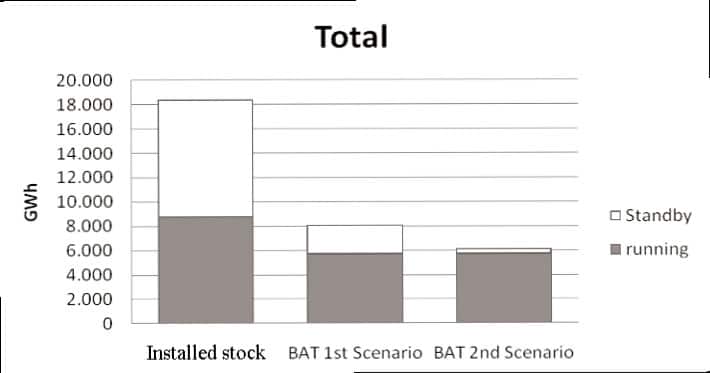
The European Energy-Efficient Elevators and Escalators project estimated 18,4TWh total electricity consumption for the elevators. 6,7TWh are in the residential sector, 10,9TWh in the tertiary sector and only 810GWh in the industrial sector. The project estimated also the savings potential considering Best Available Technologies (BAT):
The BAT 1st Scenario shows what would be possible when all existing elevators would use today available technology. The BAT 2nd Scenario shows more a visionary view, it considers what would be possible if the elevators would have just 1W standby power.
6. VDI 4707
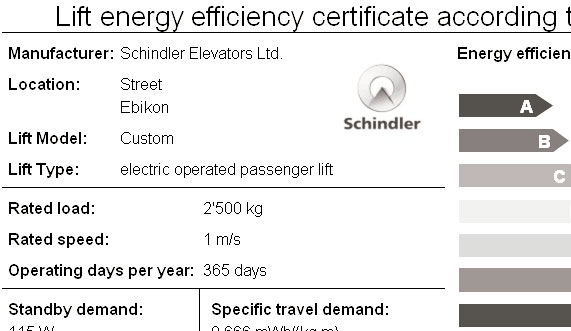
The association of German engineers VDI has considered the available research work and has published the guideline VDI 4707 that defines an energy label for lifts.
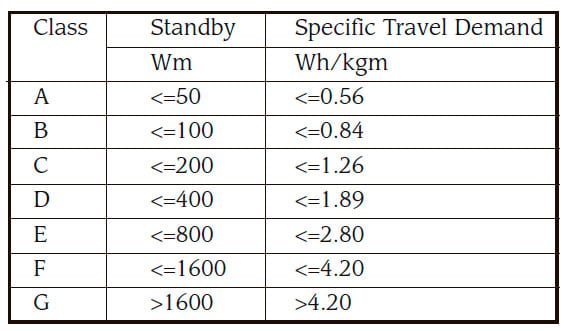
Standby and Travel have separate classifications.
The Standby Class is directly assigned to the standby power value.
The energy for a reference trip depends on shaft length and rated load. To remove these variations, the energy for a reference trip is therefore divided through trip distance travelled and rated load before it is assigned to the Specific Travel Demand Class. The impact of load and traffic is considered using the load factor (see Table 1)
Having two classes might be difficult to handle. There-fore VDI 4707 has defined the Energy Efficiency Class of the elevator that combines the two classes. Low standby values are more important than very efficient drive systems for residential elevators that do not travel very frequent. However in buildings with high traffic, the oppo-site is true. Therefore VDI 4707 defines 5 usage categories (very seldom to very frequent use).
All the results and estimates are summarized on the VDI 4707 energy efficiency label.
Efficiency of an elevator
Often a question arises, what is the energy efficiency factor η of an elevator? Efficiency factors η have to be unit less where 100% means the ideal situation.
To lift mass, ηlift can be determined as:
ηlift = (m * gn * h) / Elift . . . . . . . . . . . . . . . . . .(4)
To lower the mass, energy can be regenerated and regen can be determined as:
ηregen = Eregen / (m * gn * h) . . . . . . . . . . . . . . (5)
The energy for the reference trip can be calculated as follows:
Ereftrip= Elift – Eregen = (m * gn * h) *
(1/ηlift – ηregen) . . . . . . . . . . . . . . . . . . . . . . . . .(6)
Since no energy is converted in the reference trip, the
efficiency ηelevator would always be zero. Therefore it makes sense to use instead of efficiency ηelevator the two efficiency factors ηlift and ηregen.
Elift = Energy to lift the mass
Ereftrip = Energy for a reference trip
Eregen = Regenerated Energy
gn = Gravitational acceleration (9.81 m/s2)
h = Rise of the elevator
m = Mass difference to be moved (counterweight minus empty car)
ηlift = Efficiency factor to lift mass
ηregen = Efficiency factor to regenerate energy
References
Nipkow, J. (2005). Publication 250057. Electricity demand and saving
potential of elevators. Swiss Federal Office of Energy. 44pp
(2009). VDI-guideline 4707. Lifts Energy efficiency, Verein Deutscher
Ingenieure. 28pp
Almeida, A. (2010). ENERGY EFFICIENT ELEVATORS & ESCALATORS,
Estimation of savings. Intelligent Energy Europe, 15pp
Get more of Elevator World. Sign up for our free e-newsletter.


