Construction of Poincare Space Map and Phase Plan Map for Escalators, Part 1
Oct 1, 2021

Your author notes confirmation of smart step data’s fractal set nature.
In this study, Poincare space map and phase plan map (Poincare section) are constructed from traces of measured data obtained from running the smart step in an unloaded escalator (free of passenger loading). The constructed maps have confirmed our previous finding that the data from the smart step have a fractal set nature. The traces/attractors can be described as periodic in closed, semi-elliptical loop shapes, which have different sizes, as the smart step completes one single run/round in the escalator. The sizes of the loops become larger with the progression in the run along the coordination of the variables, then they turn back to small sizes as they go back to their origin position. The maps also show the damping effect, in the middle and end of the run, in the shapes of small loops. The data in the maps give an indication of a linear relationship in the behavior of the measured parameters. The constructions of the Poincare space map and the phase plan map confirm that the data from the smart step has a fractal-set behavior. They also suggest how deterministic or chaotic the variables behavior in the escalator are. This could be a very useful concept in classifying and categorizing escalators against their maintenance schedules.
Introduction
The designs of mechanical systems are based on utilizing linear relationships between various engineering parameters,[1] such as stress versus strain, friction force versus temperature, etc. Engineers use these relationships to construct machines and structures, but like in any complicated machine, such as an escalator, these relationships are interconnected to each other inside; therefore, the truth of the matter is these linear relationships work to a limited degree. In a mechanical system like an escalator, components and subassemblies interact with each other, generating friction forces, vibration effects/forces and heat, which increase the temperature, causing the system to behave in a nonlinear way or a properly chaotic way. This behavior could be covered in the theory of chaos,[2] which is what we are doing in this work.
The chaotic motions of mechanical or electrical systems are classified as:
- Equilibrium
- Periodic motion or limit cycle
- Quasiperiodic[1]
The behavior and pattern of a nonlinear (chaotic) system can be studied by plotting the behaviors of parameters and variables in the system on two- or three-dimensions maps, like the two-dimensional phase plan map and the three-dimensional Poincare map. Behaviors of parameters and variables are represented in lines of trajectories.[3]
The representation lines in the phase plan map of any of the above three classes are called attractors. There is a new, fourth attractor, which is called the strange attractor. It is chaotic (unpredictable), especially when there is a small uncertainty in the initial conditions of the plotted parameters. The strange attractor can also be called the fractal set.[4]
The equilibrium state is represented as a point in the phase plan, while the periodic motion or limited cycle is represented with a closed curve/loop, and the quasiperiodic motion is represented as a surface in a three-dimensional phase space. The fractal set of a strange attractor looks like a collection of infinite sets of sheets or parallel surfaces, some of which are separated by distances that approach the infinitesimal scale.[4]
The fractal set, or strange attractor, can be described in a mathematical model (equation), which can be used as a language to describe the features and behavior of the system. The model shall be endorsed with an experiment to record its behavior and quantify some of its parameters. Mathematical models could take one of three forms:
- Differential equation (or flow)
- Difference equation (called maps)
- Symbol dynamic equations
The term “flow” refers to a bundle of trajectories in phase space originating from initial conditions. The continuous time history of a particle on a line in the map or space is the most familiar example of a flow to those in engineering vibrations.[1, 5, 6]
The sections that intersect the lines of attractors in the map or space are called Poincare sections or phase plan maps. A group of these sections in a 3D coordination setting also may be called Poincare maps. The Poincare map is used to distinguish between various qualitative states of motion, such as periodic, quasiperiodic or chaotic.[1]
A Poincare map is constructed by measuring the dynamic variables. For example, in an n-state variable problem, one can obtain a Poincare section by measuring the n-1 variables when the nth variable reaches some particular value, or when the phase space trajectories cross some arbitrary plane in the plane phase. If one has knowledge of the time history between two penetrations of this plane, one can relate the position at tn+1 to that at tn through given functions.[6, 7, 8]
Smart Step Measurements
A smart step was built to run in a newly fully refurbished escalator.[9] Eight strain gauges were mounted at different locations in the step, as shown in Figure 1. The gauges were located at critical locations in the step after conducting Finite Element Analysis, or FEA, a simulation on a 3D model for the step. The step was loaded by doing axial, torsion and chain differential tests, as per the recommendations in the BS EN 115 standard.
Constructing the Map
The strain gauges in the smart step measure only one variable (strains or stresses) against time.[9, 10] The Poincare space map and the phase plan map for the nonlinear behavior of a machine like an escalator will be constructed by using the traces that we published in our previous publications.[10, 11] The Poincare space map will be constructed by using the pseudo-phase plan method (also called the embedding space method). For a one degree of freedom system with measurement x(t), one plots the signal versus itself but delayed or advanced by a fixed time constant [x(t), x(t+T)]. The idea is that the signal x(t+T) is related to x`(t) and should have a property similar to those in the classic phase plan [x(t), x`(t)]. If the motion is chaotic, the trajectories do not close.
When the state variables are greater than three (position, velocity, time or force phase), the higher-dimensional pseudo-phase-space trajectories can be constructed using multiple delays. For example, a three-dimensional space can be constructed using a vector with components [x(t), x(t+T), x(t+2T)].[1]
Results and Discussion
The data traces that we obtained in our previous studies[10, 11] have been used in this work. In one study,[11] we assessed the fractal dimension, Df, of each trace from the eight strain gauges. The assessment proved that these traces have fractal characteristics and they can be correlated to other machine-measured variables, such as maximum and average stress values generated during running the machine.
In this study, the concept of the Poincare space map and the phase plan map have been used to prove and confirm the fractal set capability of data that can be obtained from a device like the smart step.


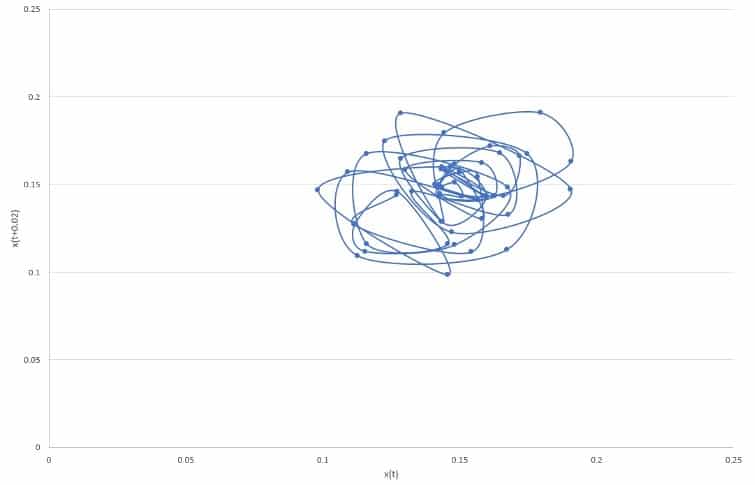
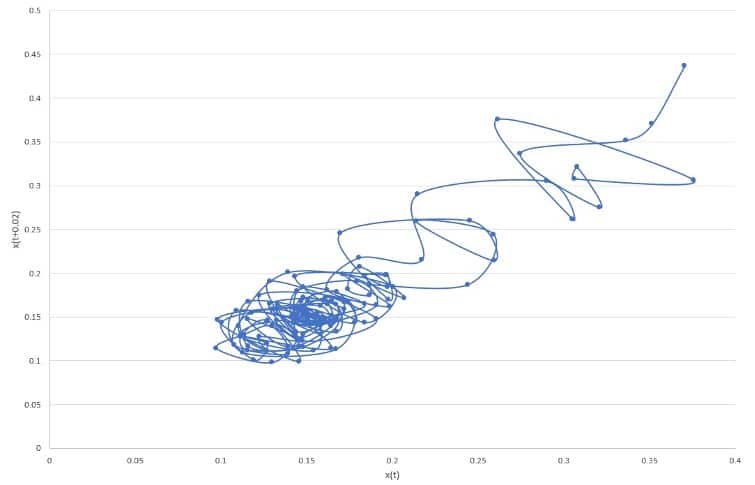
Figure 2 shows the phase plan map for the data of the nine traces from the gauges in the smart step. The traces show dense repetitive loops with progression to wide-open loops as the period of time progresses in the measurements. The data suggest a fractal look with a linear relationship between the parameters of the plot. This has been confirmed again in Figure 3 when we plotted a Poincare shape plan map for strain gauge No. 1. The data have a diagonal layout in the space, confirming the fractal nature of the measurements. It is important to notice that chaos in deterministic systems is sensitive and dependent on initial conditions of the system. This implies that the trajectory of the systems starts close to each other in the phase space, then the systems move exponentially away from each other for small times, on average. This could be true in what we see in Figure 3; however, the tractor for strain gauge No. 1 will be investigated closely.
The data traces for strain gauge No. 1 have been plotted in stages in Figure 4 to show the way the loops are formed and progressed throughout the running time of the experiment. The formation of small loops can be seen in Figure 4a, with the attractor moving from point A to point B. Dense loops start to form after passing point B, as shown in Figure 4b, leading to bigger and longer loops to point C in Figure 4c, then to point D in Figure 4d. Then, the path of the attractor will be closed to end up with a shape like the one shown in Figure 3.


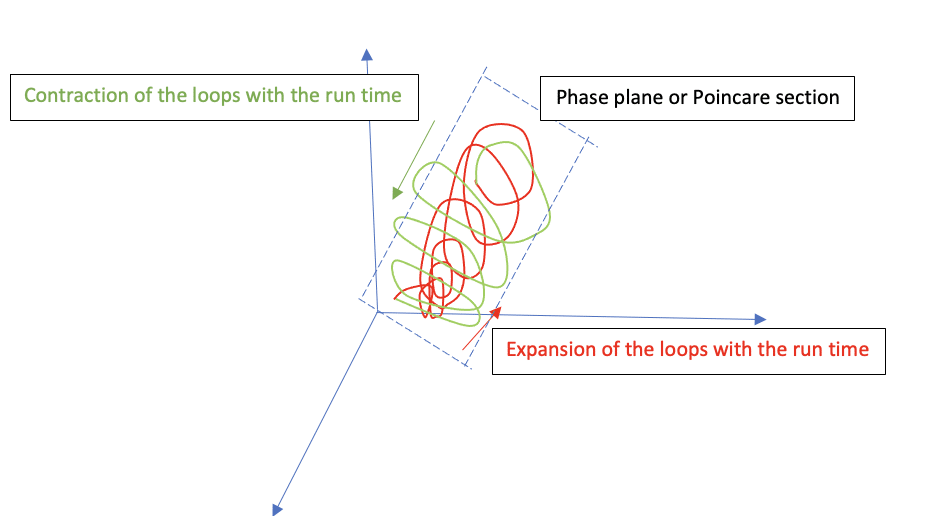
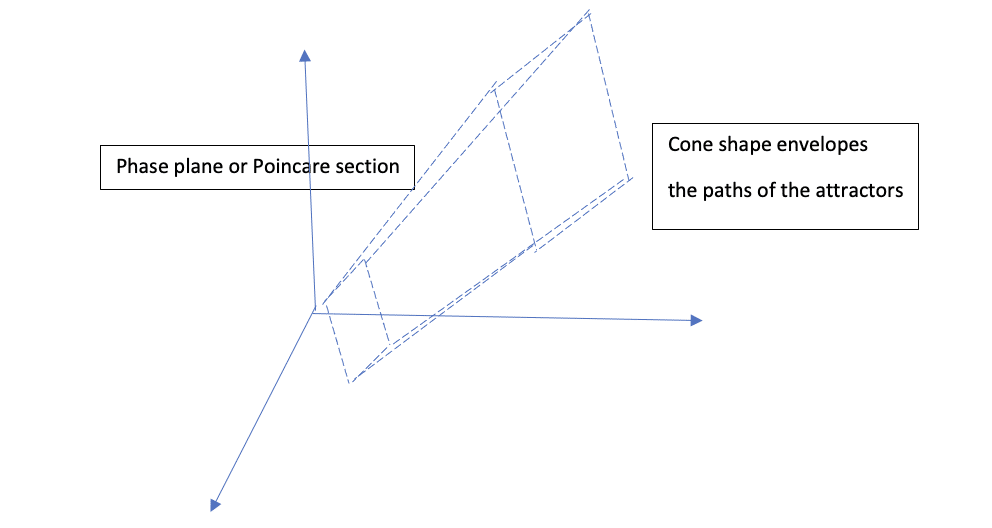
Although the plots in Figures 2, 3 and 4 are shown as 2D plots, in Figures 5 and 6, we plotted the data from strain gauge No. 1 and a 3D schematic representation to the path of its attractor. Figure 6 shows a proposed intersection between the involved cone shape of the attractor and the Poincare section.
Conclusions
The embedded nature of being fractal has been reconfirmed in this study for the set of data, which had been obtained from running the smart step in an unloaded escalator. This study is further evidence to support our previous findings.[11] The linear fractal relationship in the attractors of data in the phase plan map and in the Poincare space map has been established and confirmed. The data are chaotic but in a deterministic way, because they have close loops (periodic). The signals from strain gauges of the smart step have paths with attractors that have shown a damping effect, especially in the middle region for the running period. The shape of these attractors suggests that they can be a stable-limit cycle type, namely a steady closed oscillation that could attract all adjacent motions. The oscillations in Figures 2, 3, 4 and 5, which are schematically represented in Figure 6, show that the trajectories of small amplitude move outward while ensuring at the same time that trajectories of large amplitude move inward. The attractors do not enter the origin (0,0), because they are unstable.[1]
There is an interesting similarity between our observation in this study and that reported by Abarbael and Lall[15] when they monitored and measured the variations in the water volume in the Great Salt Lake (Figure 7). They are totally different systems with different variables, yet they behave in a similar manner.

We could think the equation that could represent the oscillations in Figures 2, 3, 4 and 5 is:
x“ + kx` + x`3 + kx = B Cos(t)
x“ = acceleration
x` = speed
c and B = constants
x = displacement
The above equation could be the keystone in developing a mathematical model to describe the nonlinear behavior of a mechanical system like an escalator.
There have been many experimental works,[12, 13, 14] which have proved that, for a given periodic forcing input to a physical system, large regions of periodic and sub-harmonic motion could exist and be predictable using classical methods of nonlinear analysis. However, these examples also show that chaos is not a singular happening; that is, it can exist for wide ranges. Most importantly, there are regions where both periodic and chaotic motions can exist, and the precise motion that will result may be unpredictable. The distribution of the data in Figures 2, 3, 4 and 5 do not give an indication of a chaotic unpredictable behavior in the measurements. Further work in this area might unveil the set of criteria and conditions for a mechanical system like an escalator to become chaotic. Defining these limits will have huge implications on escalator maintenance schedules and maintenance regimes. Compiling and using a mathematical model for the behavior of the escalator as analogy or paradigm will be useful, too.
References
[1] “Chaotic Vibration,” Francis C Moon, 2004.
[2] “Introductory Remarks,” in Dimensions and Entropies in Chaotic Systems, G. Mayer-Kress, Springer-Verlag, Berlin.
[3] “Frequency Demultiplication,” Nature 120 (3019), 363-364.
[4] “Nonlinear Dynamics and Chaos,” J.M.T. Thompson and H.B. Stewart, 1987.
[5] “Fractal and Chaos Simplied for The Life Scinces,” Larry S. Liebovitch, 1998.
[6] “Complexity: A Guided Tour,” Melanie Mitchell, 2009.
[7] “Symbolic Dynamics of One-Dimensional Maps: Entropies, Finite Precursor, and Noise,” Crutchfield, J.P., and Packard, N.H, Int. J. Theor. Phs., 21(6/7), 433-465.
[8] “Theory and Applications of Cellular Automata,” Wolfram, S., World Scientific Publ., Singapore.
[9] “Tube Lines Gets Smart to Monitor Escalator Wear,” A. Albadri, Computer Weekly.com, 07/01/2008.
[10] “Measuring Escalator Heartbeat,” A. Albadri, Elevators, Due to be published.
[11] “Escalator Fractal Behavior,” A. Albadri, Elevators, Due to be published.
[12] “Evidence of Homoclinic Orbits as Precursor to Chaos in a Magnetic Pendulum,” Moon, F.C., Cusumano, J., and Holmes, P.J., Physica D, 1987.
[13] “Experimental Models for Strange Attractor Vibration in Elastic Systems,” Moon, F.C., and Holmes, P.J., in New Approaches to Nonlinear Problems in Dynamics, P.J. Holmes, pp. 487-495, 1980b.
[14] “Period Doubling and Chaotic Behavior in a Driven Toda Oscillator,” Klinker, T., Meyer-Ilse, X., and Lauterborn, W., Phys. Lett. A 101(8), 371-375, 1984.
[15] “Nonlinear dynamics Of the Great Salt Lake,” Abarbanel, H.D., and Hall, U., 1996, system identification and predication, Climate Dynamics, 12, 287-97.
Get more of Elevator World. Sign up for our free e-newsletter.


