
Further studies on the deployment of the concept of the fractal in correlation to the mechanical performance and availability of escalators for passenger service
Part one of this series[3] showed and proved the fractal nature and behavior of data collected from the smart step, which is run in an escalator without the effect of passenger loading.[1 & 2] The systematic, consistency and repeatability features of the data have proven that they have fractal patterns and characteristics.[2] The fractal values can be used as a tool to recognize the escalator fingerprints during normal and
up-normal operation conditions. Up-normal operation conditions could manifest themselves during usage. Examples are the mechanical degradation of components in the mechanical system or a mechanical failure.
This article will show the impact of passenger loading on the fractal nature of the data from the smart step. It will show the escalator behavior during passenger loading, compared to the free loading condition. The core element this article is trying to answer is, “Would the pattern of the fractal behavior, established in Part 1, change when there is a passenger loading effect?” This study answers, “Yes; the patterns and signals profiles change by 3-10%, compared to those of the unloaded conditions. As expected, the main change in the profile of the signal is on the main passenger side of the escalator.
The analysis of a series of traces of data over time from machines has deep history. Studying the historical trends of various parameters in a machine against time shows the complex nature and behavior of the machine. More to the point, this history can guide designers and maintainers to deal with the mechanisms of the machine in a dynamic way, as the machine behavior changes with time due to wear and tear or mechanical failures.
A Scientific, Systematic Look at Behaviors and Patterns
Despite the complexity and accurate setup required for an escalator to run safely, escalator behaviors and patterns have never been looked at in a scientific and systematic way. For the last 10 years or so, we have been trying to change this culture with the help of our smart step. In previous publications,[1-3] we established that data from the smart step have the pattern of being consistent, systematic and repeatable. The data can act as a fingerprint indicator for the quality of design and pattern of operation for escalator A, compared to escalator B, for example.
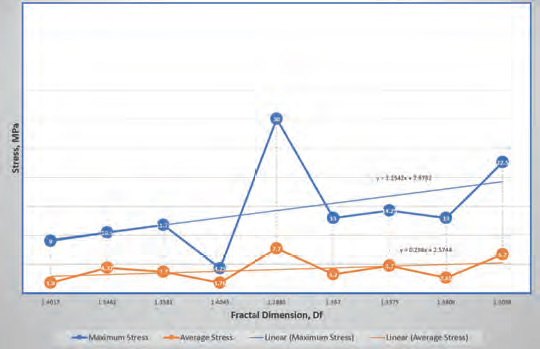
In another study,[3] we determined the fractal dimension (Df) values for different traces. The values of Df can be used to determine how smooth and stressed a specific escalator design is, or how good or bad a maintenance regime is. Indicative linear relationships were derived between the Df values and stress levels generated from the smart step. These stresses could be correlated to potential mechanical issues or failures in the escalator. Similar principles can be used on any other mechanical machines or electronic assemblies.
The basics of studying traces from electronic products and assemblies are not new. Many publications[4-7] have tried to discover the fractal nature of the signals from electronic assemblies and products. The aim of those studies was to develop efficient and effective digital output signals to quantify the behaviors of those systems in fractal models. Fractal models have made a major impact in the area of communication, particularly regarding a computer data network. Several studies have demonstrated that the network traffic loads exhibit fractal properties.[7-9] Next, we will continue to understand the fractal nature of the data from smart step when passenger loading is considered.
Methodology Used to Determine Df
Per our previous study,[3] the scaling step technique has been used used here to determine Df. A computer program was written in Microsoft Excel to determine Df and plot the data. Our methodology is very similar to the Multiresolution Length Method, which has been used by many researchers.[10-12]
The steps in the time series (s) = {s(0), s(1), s(2), s (3), . . .s(n)} of length n of the trace. Each point in the plot is represented in (xi, yi) when i = 1, 2, 3, . . .n. xi values are abscissa, and yi values are ordinate values. The Euclidean distance between two points (x1, y1) and (x2, y2) is:
dist(s1, s2) = ((x1 – x2)2 + (y1 – y2)2)0.5 (1)
The total length of the curve of the first-time resolution is calculated as:
L = I = 1∑n – 1 dist(si, si + 1) (2)
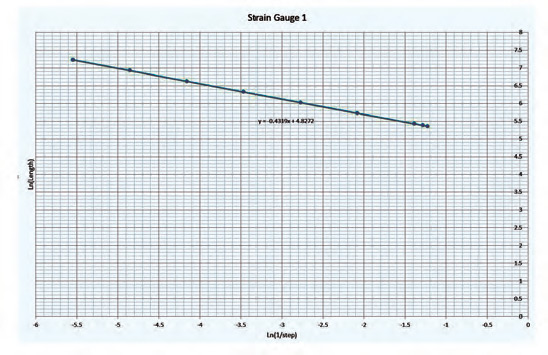
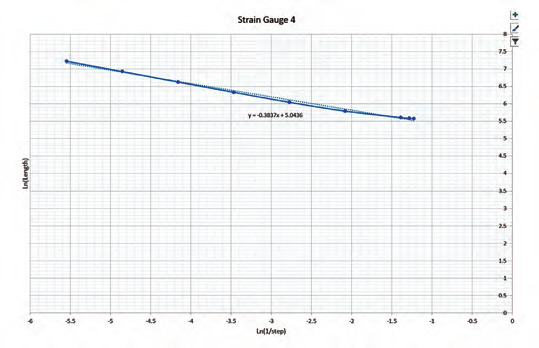
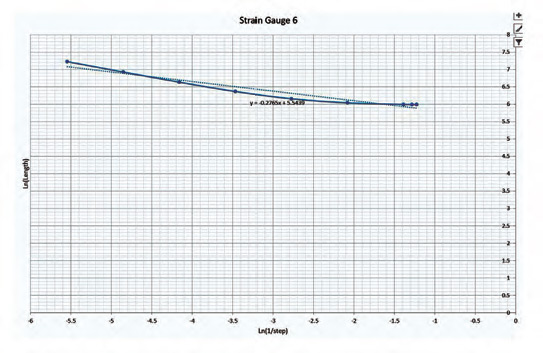
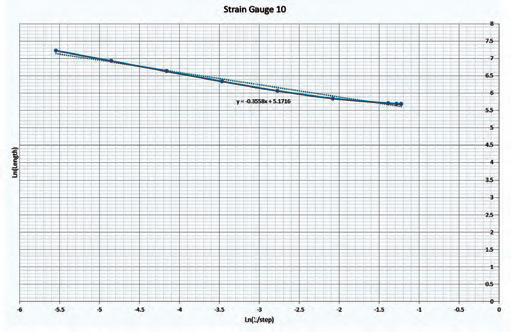
It is noted that, as the resolution becomes coarser, the estimated length of the time series becomes less accurate. Repeat the above for different resolutions (r) = r1, r2, r3, r4, . . .rp, where rp is the maximum coarsest resolution at which the length of the curve is calculated. By drawing a log-log graph (1/rk) versus (Lr) and computing the slope, Df is calculated from:
Df – 1) = -[log(Lr)/log(1/rk)] = -[slope] (3)
A smart step was built to run in a newly, fully refurbished escalator. The escalator was run with passenger loading. The passenger density was not high. Eight strain gauges were mounted at different locations in the step (Figure 1). The gauges were located at critical locations in the step after conducting finite element analysis simulation on a 3D model for the step. The step was loaded via axial, torsion and chain differential tests per the recommendations in the BS EN 115 standard.
Results and Discussion
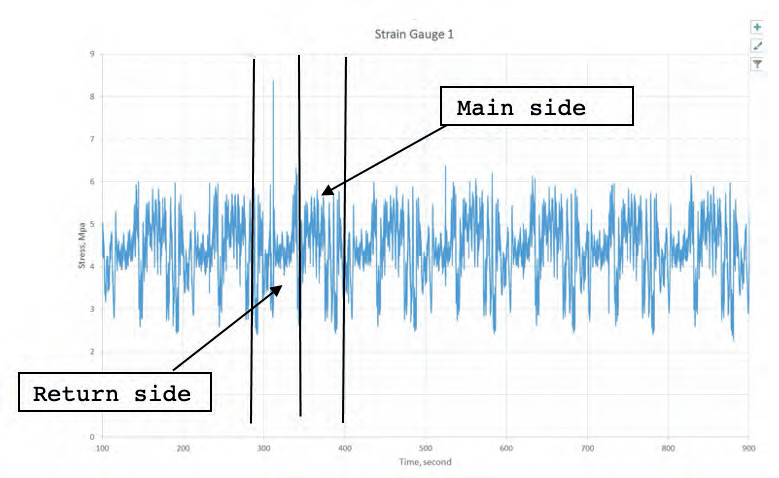
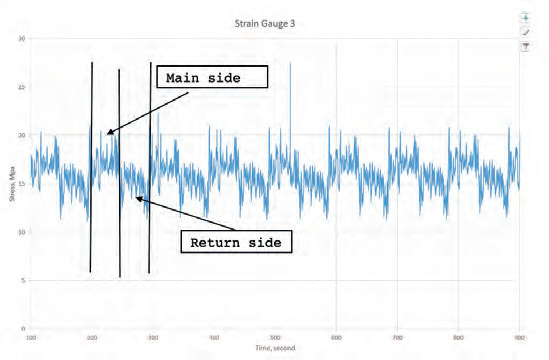
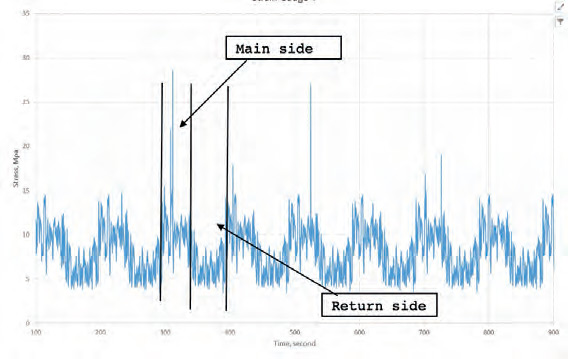
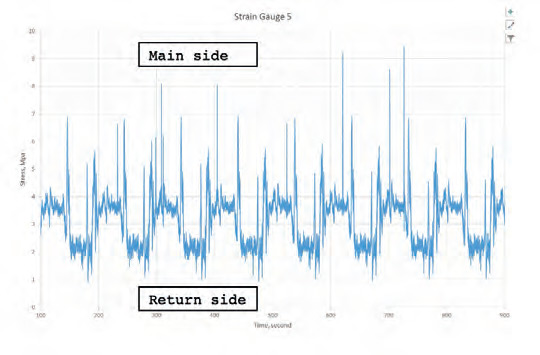
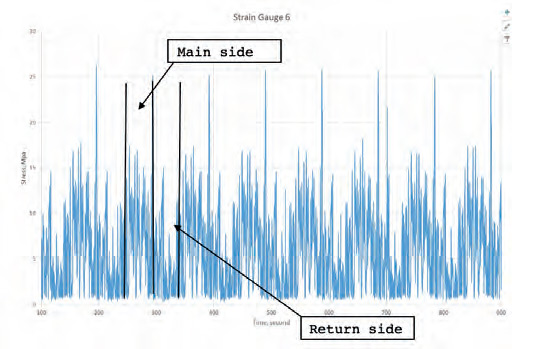
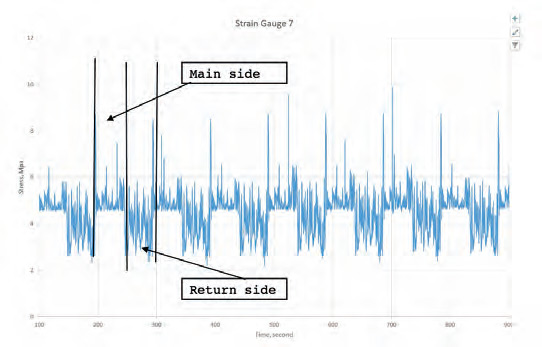
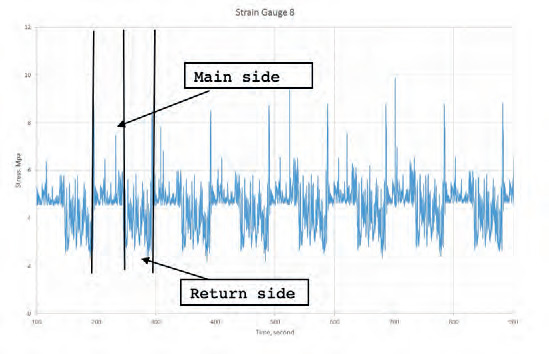
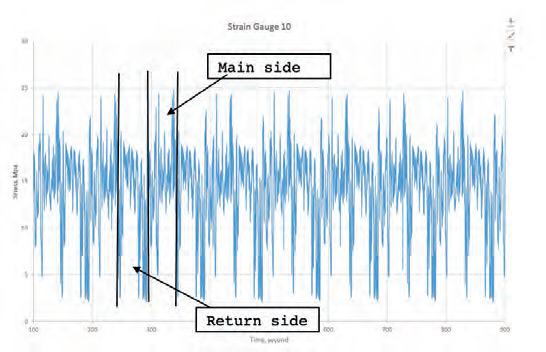
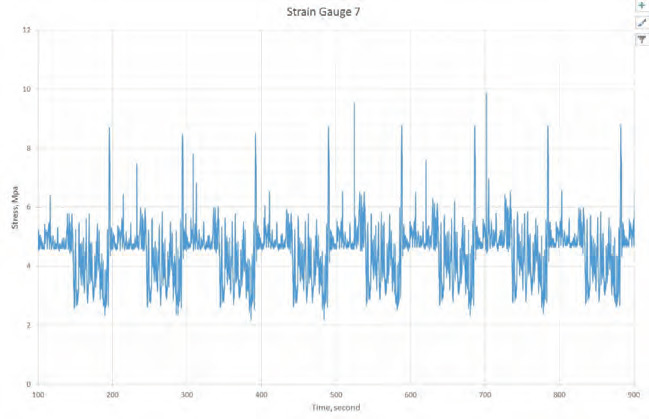
Figure 2 shows data of the traces for the nine strain gauges, which were downloaded from the smart step after running the escalator for more than 15 min. Unfortunately, strain gauge 2 developed a malfunction; therefore, the data from this gauge is ignored. Due to passenger loading, in most (if not all) of the traces, some peaks developed on the main side of the escalator. These peak stresses were generated from passengers walking or standing on the step.
Passenger density was low during the trial. An escalator with low passenger density was chosen because we did not want clatter creating signals that could become difficult to interpret. Even with low density, the effect of passenger loading made the generated signals/traces from the step rougher in patterns and appearance, especially on the main side of the escalator.
Therefore, the values of Df are higher during passenger loading, compared to those of a free-loading escalator (Table 1).
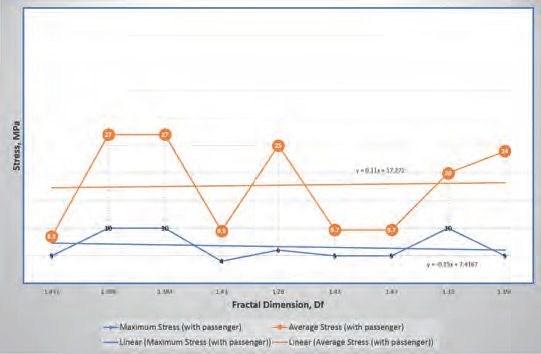
It is not a surprise not to see a manifestation of a relationship between the Df and stress levels during passenger loading (Figure 4). This is due to the variability in passenger behavior (fast or slow, walking or standing), weights, distribution (location of applied load), etc. For a plot like this, it is only fair to depend on when the escalator is free of passenger loading. However, more studies will be conducted to verify many other variables, such as high passenger density.


-

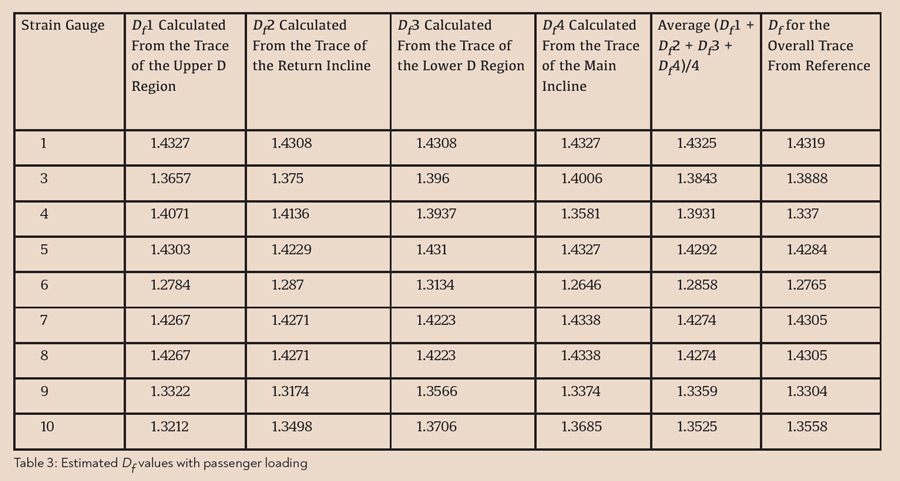
- Table 3: Estimated Df values with passenger loading
Multifractal Dimension Values in Overall Traces/Signals
Now that we have proved the fractal nature and characteristics of signal data, we can use the principles and methodology of our studies to explore and understand the actual design behavior of machines and forecast the required maintenance regimes for them. Our attempt here is to use the data we have collected so far to explore whether each Df values of a particular trace consists of multiple partial Df values. First, we will determine whether these partial Df values are controlled by simple mathematical processes, such addition and averaging, to produce the overall value of a particular Df value of an overall trace. This in-depth look will help investigators focus on a particular region or location in a mechanical system of a machine like an escalator.
This study will try to discover whether there are multifractal dimension values in overall traces/signals collected from the smart step after it has been run in an escalator. One case will be without passenger loading, and one will be with passenger loading. Similar ideas have been tried for the study of nonlinear behaviors of machines like milling and skimming workshop machines.[6] Additionally, music signals at multiple time scales have been studied. Their result was proposing the multiscale Df concept. Their method and proposal appeared to be promising for music signal analysis.[6]
As far as we are aware, no other references clarify and adopt the concept of multiple partial Df values in a way similar to that adopted in this research. We believe that our approach here will focus the minds of designers and researchers to improve machines’ performance and reliability. Local regions in overall traces of data can be scrutinized in depth using the Df concept. It may then work as a diagnostic tool to help designers and
maintainers by qualifying their machines.
Methodology Used to Determine Df
The scaling step technique has been used to determine Df. A computer program was written in Microsoft Excel to determine Df and plot the data. Our methodology is very similar to the Multiresolution Length Method, which has been used by many researchers.[4 & 7-10]
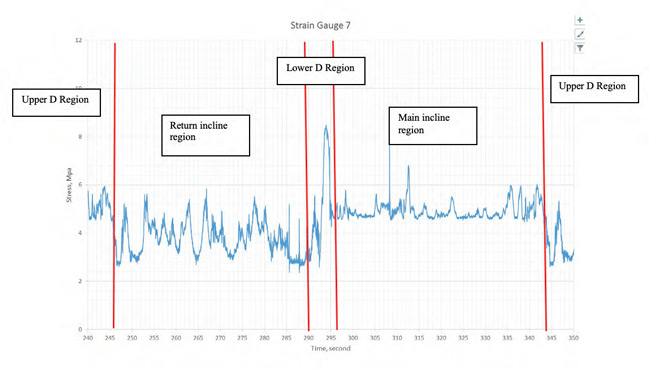
The techniques used to determine Df values and obtain the raw data/measurements from the smart step have been explained in depth.[2-3] Each trace for each strain gauge was divided into four regions: upper D region, return incline region, lower D region and main incline (Figure 5). (“D” is used to indicate the transition stages in the step band from the main to the return sides and from the return to the main side.) Figure 6 shows how the trace from strain gauge 7, for example, was divided into the four regions. Df was calculated for each region. The measurements, again, were obtained when the escalator was free of passenger loading and with passenger loading.
Results and Discussion
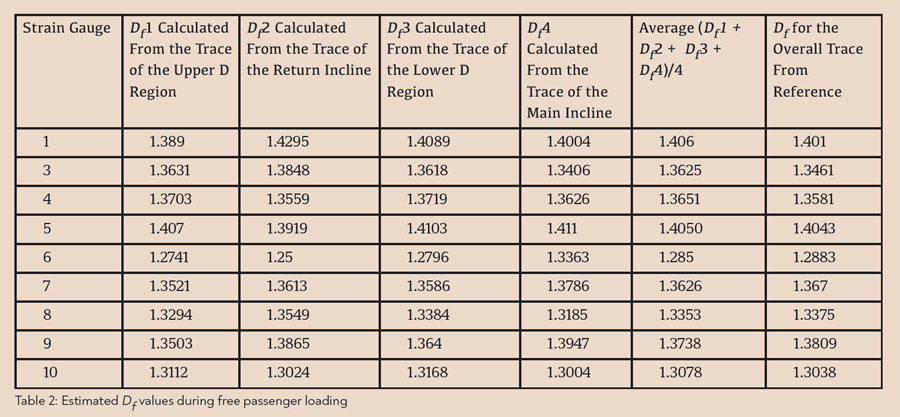
Tables 2 and 3 show the estimated Df for the measured data, which were obtained from previous studies during free passenger loading and passenger loading.[3] The tables show that each region in the escalator has its own Df value. The value for each region reflects the nature, simplicity or complexity of that region, considering other components and subassemblies in and around that region. The value can be used as an indicator or a reference to determine the health of the machine, particularly in the region under study.
The most interesting finding in Tables 2 and 3 is that the summing and averaging technique works well with the partial Df values in assessing the overall Df value. This technique has great benefits in determining the health of the escalator (or any machine). It will allow investigators like designers and maintainers to quantify the sub-behaviors of individual components and subassemblies in a machine and compare them to the overall Df value and the shape of the overall trace.

-
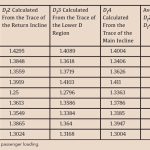
- Table 2: Estimated Df values during free passenger loading
-
- Table 3: Estimated Df values with passenger loading
Conclusions
Running the smart step during passenger loading has produced systematic, repeatable and consistent patterns of traces but with some variations in the shapes of signals in the form of more and higher peaks on the main side of the escalator during passenger loading (compared to no passenger loading). The overall patterns of the traces are rougher in appearance. The Df values during passenger loading have shown 3-10% increases compared to the Df values of a passenger-free escalator.
Due to the variabilities in passenger loading and behavior, there is not a relationship between the Df values and stress levels generated in the step. It is only fair to use such a plot for an escalator free of passenger loading. Only then will the plot show a true reflection of what is going on mechanically inside the escalator.
Measuring partial Df values for individual locations in a particular machine, like an escalator, offers many advantages to designers and maintainers in quantifying, then qualifying their machines. This study has proven the individual partial Df values can give a real reflection of the local behavior of the machine.
Adding, then averaging, the values of the partial Df of individual locations in the machine provides the overall Df value for the entire machine.
References
[1] A. Albadri. “Tube Lines Gets Smart to Monitor Escalator Wear,” Computer Weekly (January 7, 2008).
[2] A. Albadri. “Smart Step Measures Escalator’s Heartbeat,” ELEVATOR WORLD Europe, March-April 2020.
[3] A. Albadri. “Escalator Fractal Behavior, Part One,” ELEVATOR WORLD, October 2020.
[4] J.D. Victor. “The Fractal Dimension of a Test Signal Impactions for System Identification Procedure,” Biol. Cybern 57, 421-426 (1987).
[5] Chang-Ting Shi. “Signal Pattern Recognition Based on Fractal Features and Machine Learning,” Appl. Sci. 8, 1327 (2018).
[6] Francis C. Moon, “Dynamics and Chaos in Manufacturing Processes,” Wiley Series in Nonlinear Science (1998).
[7] Dumitru Scheianu and Ion Tutanescu, University of Pitesti, Electronics, Communications and Computers Department.
[8] P. Marago, A. Potamianos. “Fractal Dimensions of Speech Sounds:Computation and Application to Automatic Speech Recognition,” Journal of Acoustical Society of America, No. 195 (3) (March 1999).
[9] R.H. Riedi, M.S. Crouse, V.J. Ribeiro and R.G.Baraniuk. “A Multifractal Wave/Model With Application to Network Traffic,” IEEE Transactions on Information Theory, Vol. 45, No. 3 (April 1999).
[10] B.S. Raghavendra and D. Narayana Dutt. “Computing Fractal Dimension of Signals Using Multiresolution Box-Counting Method,” World Academy of Science, Engineering and Technology 37 (2010).
[11] D. Scheianu and I. Tutanescu. “Application of Fractal Signal,” University of Piesti, Communication and Computer Department.
[12] A. Zlatintsi and P. Maragos. “Multiscale Fractal Analysis of Musical Instrument Signals With Application to Recognition,” IEEE Transaction on Audio, Speech and Processing, Vol. 21, No. 4 (April 2013).

Get more of Elevator World. Sign up for our free e-newsletter.


