An introduction to and aid for users of the new European standard
ISO 8100-32:2020, Planning and selection of passenger lifts to be installed in office, hotel and residential buildings,[1] is a published International Organization for Standardization (ISO) standard.
ISO 8100-32:2020 is intended to offer a simple-to-use, current-practice, standardized approach in the selection of lift installations to meet traffic demands for non-experts. The Chartered Institution of Building Services Engineers (CIBSE) Lifts Group wishes to ensure persons, many of whom may not be traffic specialists, are guided in the use of this standard. Your author, as technical editor of CIBSE Guide D: Transportation systems in buildings (2020), offers this peer review of ISO 8100-32. The article makes the following nine recommendations:
- That the classical symbology (as documented in CIBSE Guide D and elsewhere) be used in reports to ensure continuity and understanding
- That the selection of rated load is based on the space occupied by P passengers and determined by reference to EN 81-20:2020, Table 6.
- That the calculation method in ISO 8100-32:2020 is used
- That the simulation method in ISO 8100-32:2020 is not used alone to make a final selection of a lift installation (though it may give some insight into a proposal)
- That designers carry out a sensitivity analysis to determine design tipping points
- That, after running an ISO simulation to ascertain an approximate design, designers carry out further checks using real-world templates
- That designers consider more data on which to base a decision
- That the charts provided in ISO 8100-32:2020 are not used to make a final selection of a lift installation (though they may give a basic indication for the defined parameters on which each chart is based)
- That a spreadsheet implementation or smartphone app of the calculation method be used for ease, convenience and accuracy
Section 1: “Scope”
The scope states what the standard covers (eight items) and what it does not (nine items). Readers are advised to study the scope carefully to confirm the applicability to their task.
Section 2: “Normative references”
There are two normative references. There is a bibliography of six items in support.
Section 3: “Terms and definitions”
There are 41 terms and definitions. Some may conflict with those published elsewhere, but those present apply specifically to ISO 8100-32:2020. Sources are indicated, and explanatory notes are provided. There is an editorial inconsistency in the presentation, as some terms/definitions include a relevant symbol, but others (for which relevant symbols exist) do not.
Section 4: “Symbols and abbreviated terms”
ISO/IEC DIR 2:2018[6] states, “The symbols and abbreviated terms clause or subclause provides a list of the symbols and abbreviated terms used in the document, along with their definitions.” Section 4 fails to do this, as it lists only 19 symbols. Readers seeking the meaning of a symbol would need to look in various places, including sections 3 and 4. This failure in editorial consistency can reduce the readability of the standard.
ISO has very important editorial standards that apply to all standards. This enables a common presentation to all users, whatever the subject. But, one size does not fit all. The “Introduction to ISO/IEC DIR 2:2018” recognizes this difficulty and states, “Those drafting ISO and IEC documents should try to be aware of the particular needs of their intended users and to write in a style that is likely to be readily understood.”
ISO/IEC DIR 2:2018 also states:
“Use of language specific abbreviated terms.
Wherever possible, language-specific abbreviated terms should not be used. When language-specific abbreviated terms which are in common use, such as ppm, are used, their meaning shall be explained.”
Many of the symbols have been editorially rendered into an unfamiliar formulation to those used by custom and practice in the lift industry for half a century. The main examples (with those in the new standard in parentheses) are:
- HC5 (Ch): Lift handling capacity (passengers per 5 min)
- %POP (%
 ): Percentage passenger demand (percentage of population per 5 min)
- RTT (trt): Round-trip time (s)
- UPPHC (Ch): Uppeak handling capacity (passengers per 5 min)
- UPPINT (tint,req): Required uppeak interval (s)
- v (vn): Rated speed (m/s) [EN81-20/ISO 8100-1, 3.4.4]
- T (tperf): Performance time
- P (Pcalc): Average number of passengers in a car at departure from the main entrance
- Pmax (Psim): Maximum number of passengers allowed in the car
It is recommended that the classical symbology (as documented in CIBSE Guide D and elsewhere) be used in reports to ensure continuity and understanding.
Section 5: “Use of this document”
ISO 8100-32:2020, Tables 2 and 3 exhibit a mathematical incongruity. The design criteria used in this standard are presented in “ISO Table 2: Typical design criteria for calculation method, depending on building type” (Table 1).
A mathematician looking at the “Office” building type would note that the conditions of the following two criteria would be met:
if: The numerical value of the required uppeak handling capacity were to lie in the range 12 to infinity (12 ≥ UPPHC ≥ ∞)
and: The numerical value of the required uppeak interval were to lie in the range minus infinity to 30 (-∞ ≥ UPPINT ≥ 30)
A negative uppeak interval is not physically achievable. Thus, the latter criterion is:
and: The numerical value of the required uppeak interval were to lie in the range zero to 30 (0 ≥ UPPINT ≥ 30)
|
Building Type |
Required Uppeak Handling Capacity |
Required Uppeak Interval |
|
Office |
≥ 12 |
≤ 30 |
|
Hotel |
≥ 12 |
≤ 40 |
|
Residential |
≥ 6 |
≤ 60 |
Table 1: “ISO 8100-32:2020, Table 2: Typical design criteria for calculation method, depending on building type”
In mathematics, this means a lift installation with infinite handling capacity and zero interval would meet the criteria. This is possible mathematically but not in practice. Prior to 1980, expert lift designers used to design to an interval (say, 30 s), then check for a reasonable handling capacity. Based on experience, experts would allow the 30-s “barrier” to be breached by a few percentage points (say, 5%) where other compensating factors were available. Since 1980, expert lift designers used the required handling capacity (passenger demand) (say, 12%) and checked for a reasonable interval. Based on experience, experts would allow the 12% handling capacity “barrier” to be breached by a few (say, five) decimal points where other compensating factors were available.
The criteria should be technically corrected and expressed as in “Revised ISO 8100-32:2020, Table 2 — Typical design criteria for calculation method, depending on building type” (Table 2). A similar technical correction needs to be applied to ISO 8100-32:2020, Table 3 by removing the “≥” qualifying the numerical values for the required handling capacity.
ISO 8100-32:2020 Table 2 corresponds with the guidance given in CIBSE Guide D, Table 3.5 with one exception: the required uppeak interval for midrange hotels has been found by experience to be ≤ 60 s (not ≤ 40 s). Readers are advised to comply with the CIBSE value.
ISO 8100-32:2020, Table 3 shows the typical design criteria and traffic mixes for traffic-condition simulation for constant demand levels. Readers are advised to see “Section 8” in this article.
|
Building Type |
Required Uppeak Handling Capacity |
Required Uppeak Interval |
|
Office |
12 |
≤ 30 |
|
Hotel |
12 |
≤ 40 |
|
Residential |
6 |
≤ 60 |
Table 2: “Revised ISO 8100-32:2020, Table 2 — Typical design criteria for calculation method, depending on building type”
Section 6: “Basic, derived and assumed data”
ISO 8100-32:2020, Table 4 corresponds with the tabular guidance given in CIBSE Guide D, Table 3.2. CIBSE Guide D offers further advice on office construction, cellular and open plan workplace areas.
ISO 8100-32:2020, Table 5 corresponds with the tabular guidance for residential buildings given in CIBSE Guide D, Table 3.4. A table for hotels is not available in ISO 8100-32:2020. Attention is drawn to CIBSE Guide D, Table 3.3.
ISO 8100-32:2020, Table 6 provides basic information on passenger transfer times. Attention is drawn to extensive guidance in CIBSE Guide D, Section 3.6.11 and Table 3.9.
ISO 8100-32:2020, Table 7 provides basic information on nominal travel times. Attention is drawn to extensive guidance in CIBSE Guide D Section 3.6.6.
Section 6.5.3
ISO 8100-32:2020 fails to apply the philosophy stated in its introduction of separating capacity and loading:
“While the entire subject of capacity and loading has historically been treated in safety codes as one and the same, it might be more meaningful in the future writing of safety codes to cover loading as a separate issue from capacity. One refers more appropriately to the traffic handling capacity, whereas the other refers to the maximum carrying capacity, which has a direct bearing on safety.”
This philosophy was first recommended in 1992 in Table 3.4 of CIBSE Guide D: Transportation systems in buildings (1992).
Readers of ISO 8100-32 should understand the convention that Pcalc is P, and Psim is Pmax.
Where ISO 8100-32:2020 Section 6.5.3 refers to sizing a lift by mass, text should be ignored: in particular, the section from the second sentence of paragraph 2 until “… may be adjusted.”
There is also an editorial error in the section where it states, “When Pmax is known, BS EN 81-20:2020, Table 6 can be used to select the rated load.” Replace the reference to BS ISO 8100-30:2019, Table 6 with BS EN 81-20:2020, Table 6. It is recommended that the selection of rated load is based on the space occupied by P passengers and determined by reference to EN 81-20:2020 Table 6.
Section 7: “Calculation method”
There are two methods of modeling lift traffic: mathematical (calculation) and digital (simulation). This section addresses calculation.
The calculation method shall follow the following procedure.
The design shall solve the following equation:
UPPHC ≥ ![]() (7)
(7)
The uppeak handling capacity (UPPHC), in persons per 5 min, of a single lift shall be calculated using:
UPPHC = ![]() (8)
(8)
Where there is a group of L lifts the handing capacity shall be calculated using:
HC5= ![]() =
= ![]() (9)
(9)
The uppeak interval (UPPINT) shall be calculated using:
UPPINT = ![]() (10)
(10)
Handling capacity in percentage of the building population served in a 5-minute period (%POP) shall be calculated using:
%POP = ![]() (11)
(11)
The RTT in seconds (s), of a single lift during uppeak traffic shall be calculated using:
RTT = 2Htv + (S + 1)tg + 2Ptp (12)
The time to travel between two standard pitch adjacent floors at rated speed can be calculated using:
tv = ![]() (13)
(13)
The time consumed in stopping shall be calculated using:
ts = tc + tsd + tf (1) − tpre + to + tcd −tv (14)
The time consumed when stopping can be expressed as:
ts = T −tv (15)
The performance time T shall be calculated using:
T = tc + tsd + tf (1) − tpre + to + tcd (16)
Assuming even population distribution, a value for S shall be calculated using
S = N [1 −(1 − ![]() )P] (17)
)P] (17)
Assuming even population distribution, a value for H shall be calculated using: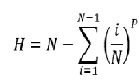 (18)
(18)
The calculated lift group handling capacity (UPPHC) should be in balance with the passenger traffic in the building and meet the given passenger demand (%POP).
Table 3: Classical traffic calculation method
Mathematical modeling has a long tail stretching back to the 1920s and beyond.[8 & 9] It became a research discipline in the 1970s at Manchester University in the U.K.[2 & 3] The present methods are developments of this work. It is based on transparent equations, which, when numerated provide a repeatable answer, which can be reproduced by another person to achieve a verifiable result.
The calculation method in ISO 8100-32:2020 is the Barney-Santos method, which has been in use for more than 50 years. It is presented in a form of nomenclature, which does not follow industry practice. This may prove confusing for readers familiar with the established custom. This formulation is explained in the prior “Section 4” in this article. The calculation method is set out in Table 1 in the familiar classical formulation. Readers are commended in its use. The values obtained can be used as guidance to a final design and a starting point for a simulation. They should not be contractually required.
Mathematical modeling is very powerful. The method provided in ISO 8100-32:2020 is very well known, but is only one of a family of mathematical models available. Others include:
- Double-deck lifts
- Unlimited travel
- Destination traffic control systems
- Door dwell times
- Unequal floor heights
- Buildings in which floor populations are not equal
- Lift groups that do not serve floors adjacent to the entrance floor (express zones)
- Lift groups that serve levels below the entrance floor
- Lift groups containing lifts with different specifications (e.g., rated load, rated speed and door types)
- The effect of passengers arriving in batches
- Passenger arrivals not following a rectangular or constant probability distribution
- Other traffic conditions: down-peak, midday and interfloor traffic
- General analysis
- Monte Carlo calculations
These extended calculation methods are presented in CIBSE Guide D Chapter 3. It is recommended that the calculation method in ISO 8100-32:2020 is used and should always be used prior to any new simulation.
Section 8: “Simulation method”
The second method of modeling lift traffic is simulation, which attempts to emulate a real-world situation. This is carried out on analog and/or digital computers. Simulators can provide a rich source of information on which to make design decisions.
Lift traffic simulation was possible in the 1970s, when digital computers became more powerful and led to computer-aided design. The foundations of modern lift-simulation techniques emerged as the result of work at Manchester University in the 1970s. Its influence can still be seen in simulation outputs today, as in CIBSE Guide D Figure 4.16.
ISO 8100-32:2020 provides a simple simulation benchmark for a design, allowing designs (and competitive offers) to be rated. Analogies are boiler efficiency benchmarks to gain an energy rating or miles-per-gallon values for a motor vehicle. The ISO simulation method requires a template that has a constant passenger demand, as its Figure 1 shows. A range of different passenger demands and traffic mixes are considered based on ISO 8100-32:2020 Table 3. Each simulation is at least 120 min long (equivalent to 24 5-min periods).
Basic Method
The simulation is run at the design value of, say, 12% (ISO 8100-32:2020 Figure 1, x1). Then, the simulation is run with higher demands, such as 13% and 14% (x2, x3). This tests if the system has either an excess of handling capacity, or is very sensitive to a small increase in passenger demand (because it is close to saturation). The output comprises a single value for the average waiting time (AWT) at each step. Example results are shown in Annex E and in a summary (Table 4).
|
Passenger Demand |
12% |
13% |
14% |
|
AWT Low rise |
2.9 s |
9.8 s |
Excess demand |
|
AWT High rise |
11.1 s |
34.1 s |
Excess demand |
Table 4: Summary for Annex E
In both cases, the design criteria are met with spare capacity; according to Annex G, the lift installation should be modified to achieve a more cost-effective design. It is recommended that the simulation method in ISO 8100-32:2020 is not used alone to make a final lift installation selection, but it may give some insight into a proposal.
Recommended Additional Checks
If a constant demand template is applied in a scenario in which passenger demand exceeds the 5-min handling capacity, the longer the simulation is run, the larger the queues become, and the more the average waiting times increase. The simulation has become unstable in control engineering (Nyquist) terminology. It may even limit cycle. A slight increase in passenger demand can result in an apparently good design becoming an unacceptable one.
In the example in ISO 8100-32:2020, Annex E, consider the required handling capacity was 13%, instead of 12%, for the high-rise design. The result shows excess demand at 14%: a 1% change in demand initiated a rapid change from a near-good design to an unacceptable one. What is not known is how close the 13% design is to being unstable. To establish this, designers should rerun the ISO simulation method with “divide by 2” steps of 13.5% and then either 13.25% or 13.75%, et seq. to understand the tipping point. It is recommended designers carry out a sensitivity analysis to determine design tipping points.
Real-World Simulations
ISO 8100-32:2020 simulations do not represent actual passenger demand in buildings but provide ways to test if a design will sustain a continuous anticipated peak demand. In the real world, traffic rises to and falls from a peak passenger demand. Templates including transients give a more meaningful result, as the lift installation may recover from the (usually short) peak.
Simulation templates should be based on the results of traffic surveys made available in the public domain. The templates should mimic the measurements of passenger demand in real buildings including transients, such as the rise to and fall from peak passenger demand typical in most buildings.
CIBSE Guide D Chapter 4 offers a range of templates, as in its Figure 4.8. These allow the designer to make alternative and complementary assessments of theoretical performance. Templates including transients allow the determination of realistic queue lengths. That assists, for example, in the review of lobby sizes.
It is recommended that, after running an ISO simulation to ascertain an approximate design, designers carry out further checks using rise-and-fall templates.
Additional Checks Beyond ISO Simulations
Simulation is a powerful tool. The ISO simulation method offers a single AWT value on which to base a decision. Simulation can provide a range of data beyond a single value, including:
- Queue lengths
- Car loading
- Average and maximum values of passenger journey, transit and travel times
- Percentiles of passenger journey, transit and travel times for any time window
- Passenger activity
- Interval graphs
- Spatial plots
- Bunching plots
- Energy graphs
- In-simulation displays
These can be presented by time, floor, lift, etc. Examples of these extended outputs are presented in CIBSE Guide D Chapter 4. Remember to run a calculation as a preliminary to any simulation to set the initial installation. It is advised that readers seek expert advice and that designers consider more data on which to base a decision.
Can Simulation Be Trusted?
Can designers and their clients rely on simulation and make the output a contract condition? A simulation engine stands between the input and output data.
ISO 8100-32 defines the input data and how the output data should be presented but does not attempt the huge task of defining the simulation engine. For example, how does the simulator deal with door reversals? Does it allow an unlimited number or just two? In destination control, how does the simulator deal with refusals? When does waiting time start?
To carry out an ISO 8100-32:2020 simulation, a party (manufacturer, consultant, etc.) would have to write an engine to carry out the simulation or use one available in the public domain. There are bound to be differences. It would not be surprising that a manufacturer’s simulator represents its products in a good light. Simple things like rounding up, rather than rounding down, or whether the update slice is event- or time-based, can affect the data. As the algorithms and data processing inside these simulators are not available in the public domain, the results will be different from each manufacturer’s simulator.
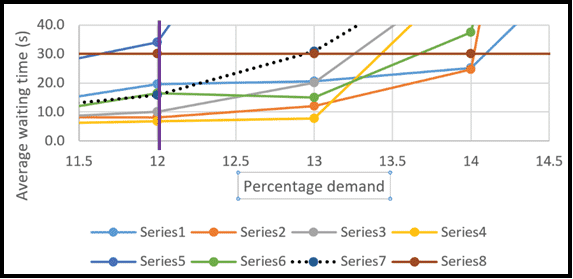
As an experiment, your author asked six parties to simulate a design.[10] The design was to run nine simulations at 1% steps of constant passenger demand, from 8% to 16%, for an office building with low and high zones, according to ISO 8100-32:2020 Section 8. Six sets of results from the simulations submitted, anonymized and “Series 1,” “Series 2,” “Series 3,” “Series 4,” “Series 5” and “Series 6.” The results were from three major manufacturers and three consultants, and carried out on three software platforms. Two simulations were carried out by the same investigator using two different simulators. Four of the sets of results were made using the same platform.
Consider Figure 1, which is a graphed extract from the results. It shows the performance in terms of the passenger average waiting time (AWT) (y-axis) against percentage demand (%POP) (x-axis). The results are significantly different.
Suppose a building designer demands in their specification that all simulations must follow the ISO Simulation Method and receives these results. Which supplier would be selected?
The percentage demand of interest is at 12%, shown as a vertical (purple) line. At that line, the average waiting times are shown in Table 5.
|
Series |
1 |
2 |
3 |
4 |
5 |
6 |
|
AWT |
19.6 |
8.1 |
10 |
6.8 |
34 |
16.5 |
Table 5: Passenger AWTs by series
Based on the evidence, Series 5 should not be considered. Series 1 and 6 are typical of the passenger experience. However, Series 2, 3 and 4 are exceptional, but it would not be possible to write these claims into a contract, as there is no procedure to prove them.
Simulation is a powerful tool but should be used with care and experience.
Section 9: “Reporting”
This is a comprehensive list.
Annex A: “Selection of rated load and available car area”
Table A.1 requires corrections:Pcalc should be P
- Psim should be Pmax
- Remove references to “persons” in column 3, based on passenger mass.
- Example 1 should be ignored, as it refers to mass.
- Example 2 refers to “area only” — mass is not considered. The reference to “A 1275 kg can have up to 2.95 m2” is taken from BS EN 81-20:2020, Table 6.
Annex B: “Speed selection”
This is too vague; use Equation 7 and Table 7.
Annex C: “Lift selection charts”
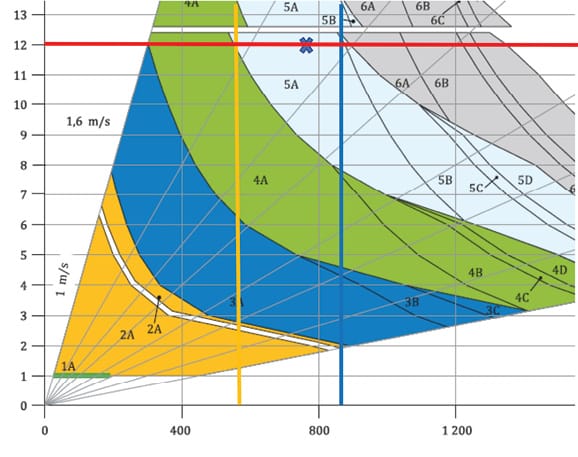
The charts use Section 7’s calculation method. They are based on KONE historical guidance dating back to ISO 4190-6: 1984.[11] The charts are calculated using the parameters defined in Annex C and are to help select a lift installation that meets the two design criteria of ISO Table 2. The rated load of a considered lift is represented by a letter. Six colored zones (Figure 2) represent the number (no) of lifts as:
- 1no: dark green
- 2no: light orange
- 3no: dark blue
- 4no: light green
- 5no: light blue
- 6no: gray
To illustrate the charts’ usefulness, consider a 12-floor office building with an interfloor height of 3.3 m. This is Section C.5.
Project 1: “Office building with 550 population”
Project 1 is shown in Figure 2 (an extract from ISO 8100-32:2020, Figure C.3) by the yellow line. Suitable installation, per ISO 8100-32:2020, is five 1275-kg lifts with a rated speed of 1.6 m/s. See Appendix 1 for a calculation.
Project 2: “Office building with 875 population”
This is shown in (an extract from ISO 8100-32:2020, Figure C.3) by the blue line. Suitable installation, per ISO 8100-32:2020, is five 1275-kg lifts with a rated speed of 1.6 m/s. See Appendix 1 for a calculation.
A traffic specialist considering these identical solutions might reason that, if the indicated installation met the 12%/30-s design criteria for a population of 550 persons, it could not cope with an increase of traffic to 875 persons. Conversely, if the design criteria were met for a population of 875 persons, the traffic specialist might reason the installation would be over-lifted for 550. The traffic specialist would be correct. The chart is flawed in this regard and should be used with care and only as very high-level guidance on an initial starting point from which to explore and develop the design using the calculation method first, followed (if required) by simulation.
It is recommended that the charts provided in ISO 8100-32:2020 are not used to make a final selection of a lift installation. However, they may give a basic indication for the defined parameters on which each chart is based. They use specific installation data, which may often not match a design or offer. For example, for residential buildings, only side-opening doors are specified; if center-opening doors were provided, the performance time would be altered. The options of faster or slower speeds for offices are not available.
Non-specialists using these charts will generally arrive at the wrong solution. It is recommended that a spreadsheet implementation (or a smartphone app) of the calculation method be used for ease, convenience and accuracy.
Annex D: “Example of calculation method and report”
This annex is correct but would benefit by use of the classical formulations. The values obtained cannot be checked onsite.
Annex E: “Example of simulation method and report”
This annex has a suitable report presentation. As the simulation engine is unknown, the results for the six average waiting times cannot be checked. Again, the values obtained cannot be checked onsite.
Annex F: “Building data form” and Annex G: “Flow chart of design process”
These annexes are useful.
Bibliography
Item (2) is normative.
Appendix 1: “Calculations to Annex C
Installation parameters are given in Section C1 as:
Interfloor distance: 3.3 m
Passenger transfer time: 1.0 s (tp) from Tables 6 and C.2
Table C.2 gives time consumed in stopping: 9.9 s. The door-closing delay time is 2 s. A-type lifts are occupied by 10 passengers (P = 10).
Evaluating Eq. (17) and (18), if N = 12, and P = 10, then S = 6.97, and H = 11.34
Eq. (13) gives tv = 3.3/1.6 = 2.06 s. ts is 9.9 + 2 = 11.9 s (Table C.2). Eq. (12) can now be evaluated. It is presented below in classical format:
RTT = 2 × H × tv + (S + 1) × ts + 2 × P × tp
Solving Eq. (12) gives: 2 X 11.34 X 2.06 + (6.97 + 1) X 11.9 + 2 X 10 X 1 = 161.16 s.
The interval for five lifts from Eq. (10) is:
UPPINT = RTT/L = 161.16/5 = 32.2 s
The handling capacity for five lifts from Equation 9 is:
UPPHC = (300 X P)/UPPINT = 3000/32.2 = 93.2 persons/5 min
The specified lift installation will provide a handling capacity of 93.2 persons/5 min and an interval of 32.2 s.
In Figure 2, the red line represents the example installation for a 12-floor building.
Consider a range of building populations from 550 persons (yellow line) to 875 persons (blue line). With a building population of 550 persons, the handling capacity required is 12% of 550 and is 66 persons/5 min. The example installation can provide 93.2 persons/5 min. It provides a %POP, using Eq. (11), of 17.0% (93.2/550). The example lift installation is over-lifted. With a building population of 875 persons, the handling capacity is 12% of 875 and is 105 persons/5 min. The example installation can provide 93.2 persons/5 min. It provides a %POP using Eq. (11) of 10.7% (93.2/875). The example is under-lifted. There is only one place on this red line where the 12% criterion is exactly met: for a population of 777 persons, shown with a blue “X.” In all cases, the interval is 32.2 s, and the 30-s criterion is not met. However, an expert designer might accept it.
References
[1] ISO 8100-32:2020, Planning and selection of passenger lifts to be installed in office, hotel and residential buildings, (2020).
[2] G.C. Barney and S.M. Dos Santos. “Improved traffic design methods for lift systems,” Build Sci. Vol. 10, p. 277-285 (1975).
[3] G.C. Barney and S.M. Dos Santos. “Lift traffic design and control,” Peter Peregrinus (1977)
[4] Schindler (www.schindler.com/com/internet/en/media/behind-the-scenes/stories/schindler-setstraffic-planning-industry-standard.html).
[5] Schindler (www.newswit.com/.prop/2020-07-15/df70447ba3feff0abd703dc783350b46).
[6] ISO/IEC Directives Part 2, Principles and rules for the structure and drafting of ISO and IEC documents, Edition 8.0 (2018).
[7] CIBSE Guide D: Transportation systems in buildings (2020).
[8] B. Jones. “The probable number of stops made by an elevator,” General Electric Review 26, 8, p. 583-580 (1925).
[9] J. Schroeder, Personenaufuge. Foerden und Heben, 1 (1955).
[10] Gina Barney. “Can lift traffic simulators be verifiable, transparent, repeatable and reproducible?” Lift and Escalator Symposium, Northampton, U.K. (2019).
[11] BS ISO 4190-6: 1984 Lifts and service lift – Part 6 Passenger lift to be installed in residential buildings – Planning and selection, (1984).
Get more of Elevator World. Sign up for our free e-newsletter.