Methods for the Safety Integrity Determination of an Electric/Electronic/Programmable Electronic System
Mar 1, 2013
by A. Mutu, Y. Pang, J. van Vliet and G. Lodewijks
This paper was presented at  USA 2012, the International Congress on Vertical Transportation Technologies and first published in IAEE book Elevator Technology 19, edited by A. Lustig. It is a reprint with permission from the International Association of Elevator Engineers
  (website: www.elevcon.com). This paper is an exact reprint and has not been edited by ELEVATOR WORLD.
Key Words: Safety, safety integrity determination, electric/electronic/programmable electronic system.
Abstract
Systems comprised of electrical, electronic and/or, more recent, programmable electronic systems (E/E/PES) are widely in use for performing safety functions. There is a major interest in the correct safety integrity determination of these systems, as their unavailability might lead to catastrophic events. This paper reviews current approaches to determining the safety integrity of an E/E/PES in safety related applications. It filters these methods by the specifics of the lift industry and it proposes an applicable solution. A practical example of an E/E/PE system performing a safety function from the lift industry is given and its safety integrity determination is modelled with respect to the chosen technique.
1. Introduction
Many industries such as oil, gas, chemical, aerospace or automotive are increasingly depending on the good performance of the electric/electronics and programmable electronic systems (E/E/PES) in safety related applications (SRA). Recently, the E/E/PES were also adopted in performing functions in safety related applications for lifts (SRAL). Unlike other industries, the experience of the lift industry with E/E/PES in SRA is limited.
The E/E/PES in SRAL have not been sufficiently in use to reveal their real performance in time and all their possible failure modes. However, they are accepted as safe solutions in the lift industry on the basis of a risk analysis (Lemmers and Striekwold 2001).
The risk analysis is meant to assess the safety achieved by the E/E/PES and to provide, as output, a numerical value for the safety achievement. The determined numerical value is named safety integrity (SI) and it is defined as the probability of an E/E/PES safety-related system satisfactorily performing the specified safety function under all the stated conditions within a stated period of time (IEC 2010).
The risk analysis method used in determining the SID is going to be further named the safety integrity determination (SID) method as it represents the method of determining the reliability of the E/E/PES to perform the safety function. The difference in terminology is important as the risk analysis methods cover a wide range of applications and the nature of the results can vary, meanwhile the SID methods refers only to the risk analysis suitable for determining the safety integrity of the E/E/PES and it provides quantitative results only.
The E/E/PES in SRAL are systems with no practical experience (not proven in use reliability), no performance in time known and no failure modes revealed. The only remaining mean of validating their overall safety achievement (that is proving the certainty of avoidance of failures in a system) is by a correct performance and evaluation of the SID process. That requires, besides the experienced assessors also an appropriate SID method to be applied. Some general SID methods applicable to the E/E/PES used in SRA are recommended by the standards (IEC 2010), others are to be encountered in governmental documents (John Gould, Michael Glossop et al. 2000) or even some still at the stage of research (Redmill, Chudleigh et al. 1997). However, their applicability to a particular industry needs to be further analysed as not all the given/encountered methods are suitable to the stage of development in that particular industry.
In other words, the characteristics of the SID methods to be used for a specific application need to match the level of knowledge and development of the specific industry of that application. For example in new systems with no experience in use and no data over their failure mode (such as E/E/PES in SRAL systems), the usage of a SID method that requires data knowledge over the system’s failure modes is inappropriate. A SID method based on the data from individual components is more suitable in this case. At the same time, for consecrated designs (such as those used in avionics, for example) the usage of a SID method that requires data over the components means redundant work as the safety integrity of the system was previously determined and validated by the onsite experience.
The purpose of this paper is to introduce the concept of SID in safety related applications for lifts. It reviews the currently available risk assessment methods possible to be used as SID methods and it filters their applicability through the requirements and limitations of the lift industry. The currently best suitable SID method as identified in this paper is applied on the electronic overspeed governor – one of the mandatory safety components of a lift installation.
2. Safety Integrity Determination
The usage of E/E/PES in SRAL brought a series of specific terms associated with these systems only. The main terms and their definition are given in Table 1.
For an E/E/PES it is firstly important that it performs a SF. The terms, as defined in Table 1 are not to be used for E/E/PES other than those performing a SF.
In SRAL the main SFs patented to be implemented by means of E/E/PES are landing and car door locking devices, overspeed governors and emergency switches (Alfredo Gómez, Angel Gimeno et al. 2008) used in preventing crushing or falling hazards.
For an E/E/PES performing a particular SF, its SI value has to be identified. The value of its SI is identified on the basis of a risk analysis. As the risk analysis represents a vast concept, used in various applications, not strictly related to safety issues, and the nature of its results can be both qualitative and quantitative, the term is hereby proposed to be replaced by the term SID.
The SID, as here proposed is a particular new concept to be used for the determination of the SI of a given SF implemented via an E/E/PES in SRAL. A SID can be applied only for E/E/PES, performing a SF in a SRAL and the nature of the results is strictly quantitative, respective the SI of the analysed system. The value of the SI, provided as output of the SID step, imposes the corresponding discrete level – the SIL – for the particular system given. The SILs as defined by the (IEC 2010), are given in a summarized form in Table 2.
The SIL for a system determines the hardware and architectural constrains for that system. The highest the SIL, the more redundancy and diversity is demanded from the analysed system, consequently higher reliability of the system is achieved but also higher costs are involved. Therefore, for an E/E/PES performing a SF it is important to determine not the SIL, but the correct SIL for a particular application.
The correct SIL that would successfully combine the safety achievement in an E/E/PES system performing a SF with the costs associated with the hardware implementation of the system. A backwards analysis indicates that a correct SIL is conditioned by a correct SI and a correct SI is the result of a correct SID performance.
3.Methods
The identification of the methods possible to be used as SID methods in SRAL is based on the investigation of several industries such as oil, gas, chemical, nuclear, aircraft or automotive. Based on this investigation, 9 methods currently available to possibly be employed for the SID in SRAL were determined. The methods together with their abbreviation and relevant sources of information are as given in Table 3.
The characteristics of each identified SID method were overviewed and given in a summarized form in Table 4. The construction of Table 4 is similar to that proposed by (Rouvroye and van den Bliek 2002) and used in comparing various safety analysis techniques.
The most suitable method to be used for the SID in SRAL is the one that requires the least available data as input and that covers the most of the technical aspects associated with E/E/PES in SRAL. The available input data for the E/E/PES used in SRAL consist of components failure mode and data.
The system’s failure mode and data are currently unavailable, as the E/E/PES in SRAL have limited operational experience. This makes the SID methods that require data over the system’s failure unsuitable for the current stage of development of E/E/PES in SRAL.
Therefore, techniques such as PN, MCS and MA, although they stand out with the number of technical aspects covered, they are unsuitable to the stage of development in the lift industry. Among the remaining methods, FTA, ETA, CCA, FMEA, FMECA and RBD, the selection is done in the favour of the method that covers the most of the technical aspects of the E/E/PES in SRAL. From Table 4, the CCA method is to be selected as the most appropriate to be used with the current stage of development and knowledge for the E/E/PES in SRAL.
4. Application
To demonstrate the CCA’s applicability to SID in SRAL, the method is exemplified on the electronic overspeed governor (EOS). The EOS is one of the mandatory safety devices (mandatory as device but not as technology) encountered in a lift installation with the role of stopping the lift when this attains a predetermined speed. In other words, the SF implemented via the EOS is composed out of the ovespeeding detection, evaluation of the predetermined speed considered as dangerous and reacting by opening the lift’s safety circuit (SC) – cutting off the power supply – in order to bring the lift installation to a safe state. In a failure mode, the EOS, can also mechanically engage the safety gear (SG) of the lift installation.
The elements of the EOS’s SF implemented in a lift installation are as given in Figure 1. To be noted that all the elements of the SF implemented via the EOS have double redundancy.
The SI of the SF is determined by individual determination of the SI for detection, evaluation and reaction blocks that constitute the SF. For exemplifying purposes, only the reaction part of the SF implemented via the EOS is going to be further discussed.
The reaction system should be engaged only after the detected speed was evaluated as overspeed. The reaction system is composed out of two safety relays (SR) having the same constructive type. One safety relay works as primary triggering device (SR1) and the second one is working as standby unit (SR2).
That makes the analyzed system a reaction system, in a SRAL with standby unit. The output from the evaluation unit is feeding both SRs and both intended for opening the SC of the liftinstallation, as schematically given in Figure 2.
The CCA is developed for the critical event – SR1 fails to open the SC. The cause of this failure is developed in the cause diagram for the SR1 – fails to open the SC and its consequences are further analyzed based on the encountered events in the system. The CCA so developed is as given in Figure 3.The symbols as used on the diagram and their significance as introduced by (Nielsen 1971) are given in Table 5.
For the quantification of the CCA diagram, a series of values had to be firstly determined or assumed for the basic events as identified on the diagram. The basic events are represented on the diagram as circles and they are the limit of development for the cause diagrams.
The assumption made are for explanatory purposes only and in real applications, the here assumed values have to be determined.
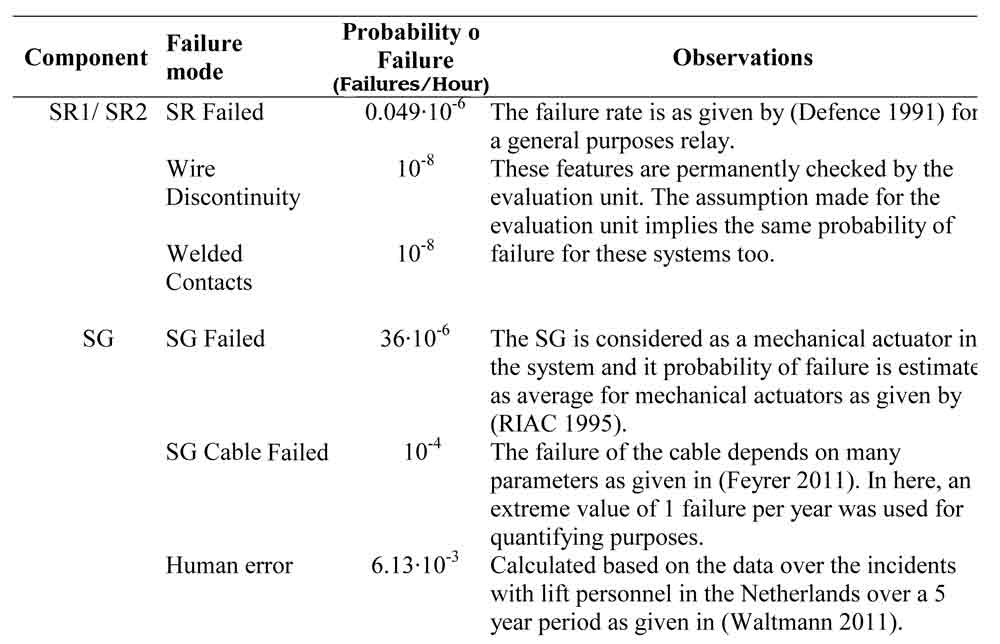
The “No output signal form the evaluation unit” block was assumed to have the probability of failure for SIL 3 systems in high demand mode – that is 10-8 to 10-7 failures/hour (see Table 2). The lowest limit of the domain was considered in further calculations. The wire discontinuity and the state of the contacts of the relay are monitored by the same evaluation unit therefore their probability of failure is imposed by the probability of failure of the evaluation unit. The rest of the basic events were quantified as given in Table 6.
With the values as given in Table 6 and the logic of the analysis as shown in Figure 3, the following values, as give in Table 7 for the mode of failure of the redundant reaction unit in an EOS are obtained. The determined numerical values are based on the logic sequence of the 3 possible paths of failure for a system as given under the critical event assumed.
The Safe failure mode presents no risks for the analysed system. For a reaction unit in a safety function the Safe failure mode it actually represents the normal operating mode. As determined from the CCA, the probability of the analysed system to safely perform is very close to one. The total risk of the system, its probability of failure in time, or its SI, is represented by the sum of probabilities of Fail Safe and Fail Dangerous modes, as given in Table 6, and that is 2.043·10-8 Failures/Hour. From Table 1 the SIL of the redundant reaction unit of an EOS is SIL 3.
5. Conclusions
The paper introduced the concept of safety integrity determination and showed its applicability in the lift industry through the cause-consequence analysis. The SID concept as here proposed is to be further used in relation to the E/E/PES in SRAL and their SI.
The CCA method proved to be suitable to the actual requirements and limits of the lift industry. The CCA provides not only clear logic of the SID but also possible failure modes of the system. Moreover, a correct quantification of the CCA diagram leads to the ranking of the possible failure modes.
Until experience with E/E/PES in SRAL is gained, the CCA represents a clear and well documented method for the SID of these systems. The method can be cope with test and repair procedures (Nielsen, Platz et al. 1975) and the development of the diagram can be automated (Valaityte A., Dunnett S.J. et al. 2010).

Figure 1: The main parts of the SF implemented by the EOS 
Figure 2: Schematic representation of the reaction unit of an EOS 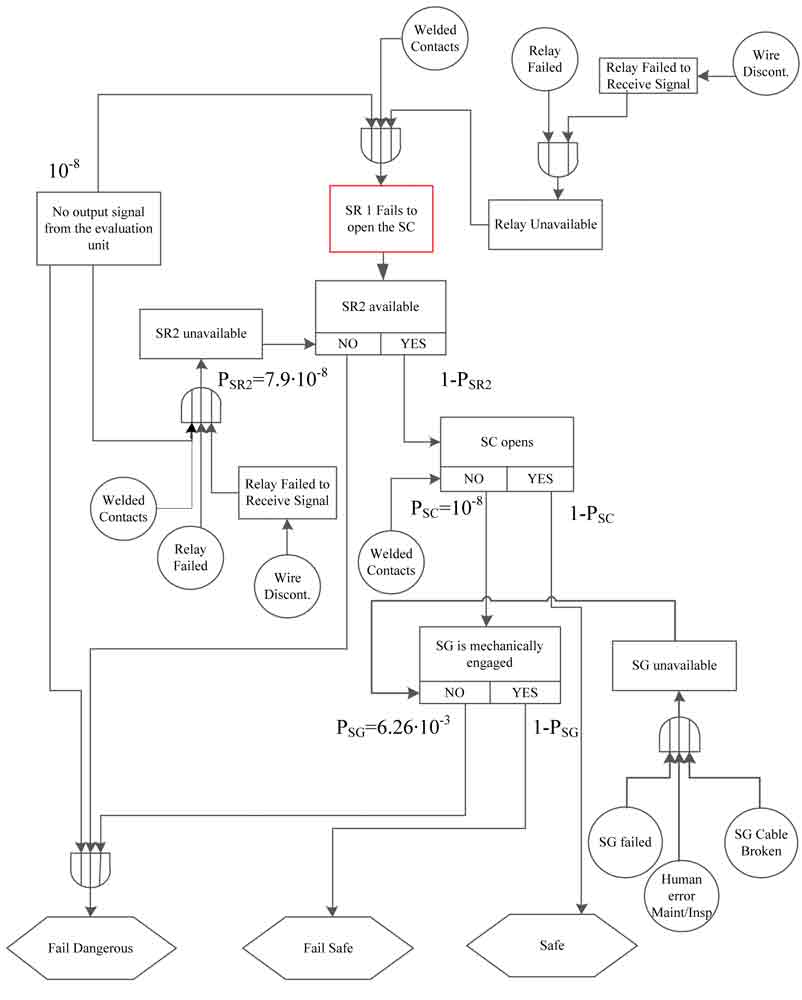
Figure 3: CCA for the SR 1 Fails to open the SC 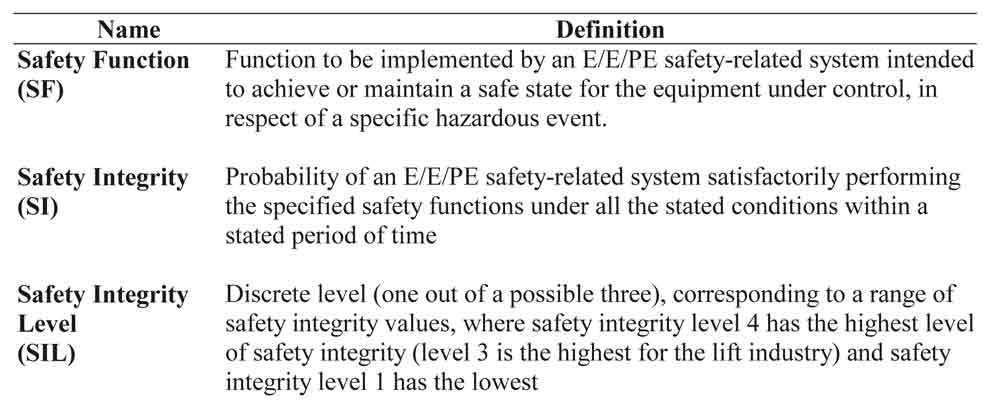
Table 1: Specific terms for E/E/PES in SRAL 
Table 2: Safety Integrity Levels (Smith and Simpson 2011) 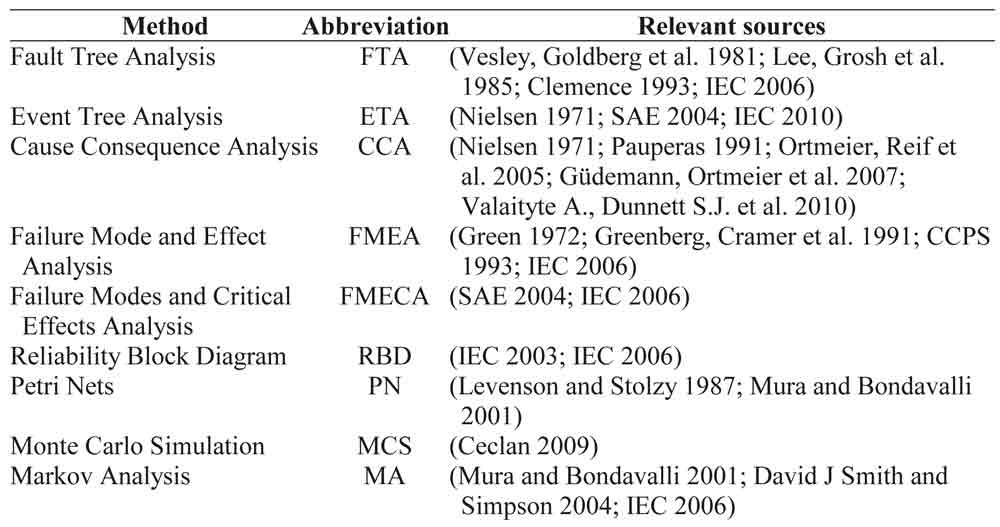
Table 3: The available SID methods and their main sources of information 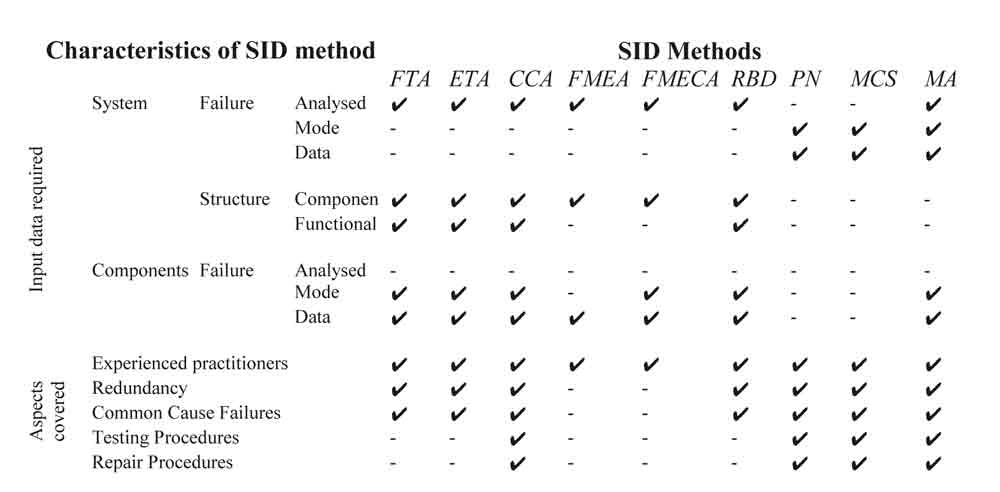
Table 4: The available SID methods and their characteristics 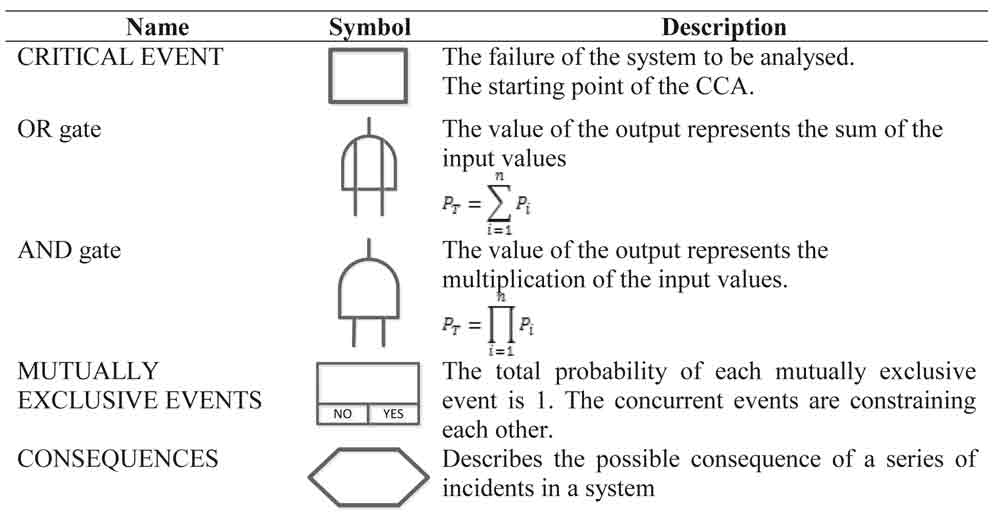
Table 5: The symbols used in the CCA 
Table 7: Consequences ranking
REFERENCES
Alfredo Gómez, Angel Gimeno, et al. (2008). PESSRAL – Present Situation and Technological Trends. Elevcon, Thessaloniki, Greece, IAEE – International Association of Elevators Engineers
CCPS (1993). Guidelines for Safe Automation of Chemical Processes. New York, American Institute of Chemical Engineers.
Ceclan, A. (2009). Contributii la regularizarea unor probleme inverse electromagnetice incorect formulate. Electrotechnics. Cluj, Technical University of Cluj-Napoca.
Clemence, P. L. (1993). Fault Tree Analysis. Sverdrup.
David J Smith and K. G. Simpson (2004). Functional Safety – A straightforward guide to applying IEC 61508 and related standards. Oxford, Elsevier
Defence, D. o. (1991). Military Handbook. Reliability prediction of electronic equipment Washington, Department of Defence: 205.
Feyrer, K. (2011). The service lives of running wire ropes under the influence of size effect. Lift Report. Germany, Lift Report.
Green, A. E. (1972). Reliability Technology, Wiley.
Greenberg, H., J. Cramer, et al. (1991). Risk assessment and risk management for the chemical process industry, Van Nostrand Reinhold
Güdemann, M., F. Ortmeier, et al. (2007). “Using Deductive Cause-Consequence Analysis (DCCA) with SCADE “ Computer Safety, Reliability, and Security 4680: 465-478.
IEC, I. E. C. (2003). Safety instrumented systems for the process industry sector. Part 2: Guidelines for the application of IEC 61511-1. Geneva, IEC: 82.
IEC, I. E. C. (2006). Analysis techniques for dependability. Reliability block diagram and boolean methods. Brussels, International Electrotechnical Commission: 90.
IEC, I. E. C. (2006). Analysis techniques for system reliability Procedure for failure mode and effects analysis (FMEA). Geneva, International Electrotechnical Commission: 62.
IEC, I. E. C. (2006). Application of Markov techniques. Brussels: 84.
IEC, I. E. C. (2006). Fault Tree Analysis. Geneva, International Electrotechnical Commission 103.
IEC, I. E. C. (2010). Analysis techniques for dependability Event tree analysis (ETA). Brussels, CENELEC: 54.
IEC, I. E. C. (2010). Functional safety of electrical/electronic/programmable electronic safety-related systems – Part 4. Definitions and abbreviations. Geneva, Switzerland, International Electrotechnical Commission.
IEC, I. E. C. (2010). Functional safety of electrical/electronic/programmable electronic safety-related systems – Part 7. Overview of techniques and measures. Geneva, Swit-zerland, International Electrotechnical Commission: 154.
John Gould, Michael Glossop, et al. (2000). Review of Hazard Identification Techniques H. a. S. Laboratory. Sheffield, Health and Safety Executive. HSL/2005/58: 48.
Lee, W. S., D. L. Grosh, et al. (1985). “Fault Tree Analysis, Methods, and Applications ߝ A Review.” Reliability, IEEE Transactions on R-34(3): 194-203.
Lemmers, R. and P. Striekwold (2001). Safety for sale. Elevcon, Singapore, IAEE – International Association of Elevator Engineers.
Levenson, N. and J. Stolzy (1987). “Safety Analysis Using Petri Nets.” IEEE Transactions on Software Engineering 13(3): 386-397.
Mura, I. and A. Bondavalli (2001). “Markov Regenerative Stochastic Petri Nets to Model and Evaluate Phased Mission Systems Dependability.” IEEE Trans. Comput. 50(12): 1337-1351.
Nielsen, D. S. (1971). The Cause/Consequence Diagram Method as a Basis for Quantitative Accident Analysis Danish Atomic Energy Commission Research Establishment Riso. Riso, Riso – M – 1374: 28.
Nielsen, D. S., O. Platz, et al. (1975). “A Cause-Consequence Chart of a Redundant Protection System.” Reliability, IEEE Transactions on R-24(1): 8-13.
Ortmeier, F., W. Reif, et al. (2005). “Formal Safety Analysis of a Radio-Based Railroad Crossing Using Deductive Cause-Consequence Analysis (DCCA) “ Dependable Computing – EDCC 5 3463: 210-224.
Pauperas, J. (1991). Cause-consequence analysis of a generic space station computer system. Reliability and Maintainability Symposium, 1991. Proceedings., Annual.
Redmill, F., M. F. Chudleigh, et al. (1997). “Principles underlying a guideline for applying HAZOP to programmable electronic systems.” Reliability Engineering & System Safety 55(3): 283-293.
RIAC, R. I. A. C. (1995). Nonelectroni Parts Reliability Data D. o. Defence. Washington, RIAC.
Rouvroye, J. L. and E. G. van den Bliek (2002). “Comparing safety analysis techniques.” Reliability Engineering & System Safety 75(3): 289-294.
SAE, S. o. A. E. (2004). “Use of fault tree analysis for automotive reliability and safety analysis.”
Smith, D. J. and K. G. L. Simpson (2011). Safety Critical Systems Handbook. Oxford, Elsevier.
Valaityte A., Dunnett S.J., et al. (2010). “Development of an algorithm for automated cause-consequence diagram construction.” International Journal of Reliability and Safety 4(1): 46-48.
Vesley, W. E., F. F. Goldberg, et al. (1981). Fault Tree Handbook. Washington, US Nuclear Regulatory Commission.
Waltmann, T. (2011). Ongevallen met liftmonteurs steed beter geregistreerd. LiftInstituut Magazine Amsterdam, LiftInstituut: 43.
Get more of Elevator World. Sign up for our free e-newsletter.


