An Improved and More Accurate Method to Calculate the Energy Consumption of a Lift
Sep 1, 2013
It is often necessary to select the best performing lift installation in terms of energy efficiency, for example, to gain the first credit in the Building Research Establishment Environmental Assessment Method classification system (other environmental rating classifications exist such as LEED, Green Star, etc.). Previous energy consumption calculation methods have been inaccurate such as that suggested in CIBSE Guide D: 2010. A more accurate method has been developed by an International Organization for Standardization (ISO) TC178 Working Group 10. This was published in ISO/DIS 25745-2 on June 6, 2013. A simplified form of the calculation method is given here.
Given Data
The method relies on knowledge of three data sets: known data, measured data and estimated data.
Known data for the target installation is the design data. These data are: rated speed; rated load; acceleration value; jerk value, terminal floor to terminal floor distance; the number of stops; the time for the opening, opened and closing times of the lift doors at the landings; and counter balancing ratio.
Measured data is obtained using the method specified in EN ISO 25745-1: 2012 either from an actual target installation or a test tower facility set to emulate the target installation. These data are: running energy consumption; standing idle energy consumption; standing standby energy (these terms are defined in BS EN ISO 25745-1:2012). In the absence of measured data, values obtained by simulation may be used.
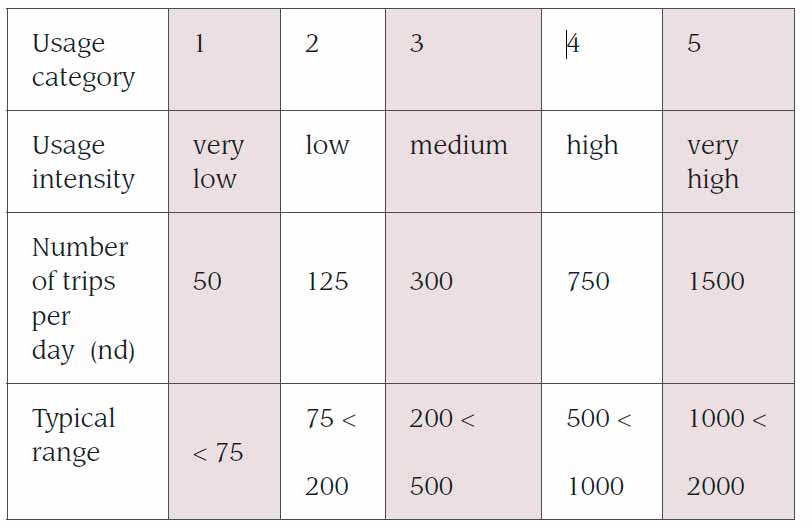
Estimated data is an indication of the activity of the installation ranging from very low to very high activity. This data is represented by the number of trips per day.
Estimated Daily Energy Consumption
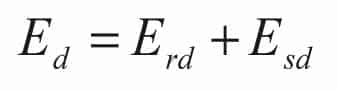
The estimated daily energy consumption (Ed) of a lift is the sum of the running consumption (Erd) and the standing (idle/standby) consumption (Esd):
Estimated Daily Running Energy Consumption
The daily running consumption (Ed) is dependent on the energy used for an average trip that the target lift makes multiplied by the number of trips in a day (nd). The running energy consumption (Erc) used to perform the ISO reference cycle (an outward travel of an empty car from one terminal landing to the other terminal landing and return) is given by the measurement made according to EN ISO 25745-1: 2012. This running energy measurement is for an empty car traveling the distance between the terminal landings (src). The distance traveled for an average trip (sav) is less than the distance between the terminal landings and can be expressed as a percentage of the distance (src), i.e.: %S = sav/src.
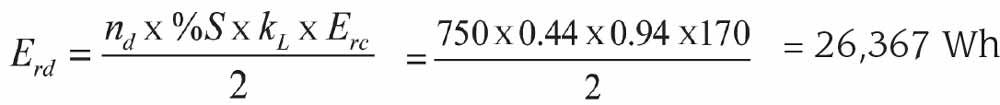
The running energy measurement is made with an empty car. In operation, the lift will carry passenger loads from zero to full rated load. In general, the average loading is low. To correct for loaded cars, the running energy needs to be corrected by a load factor (kL). Thus, the daily running consumption (Ed) in Wh is given by Equation 2:
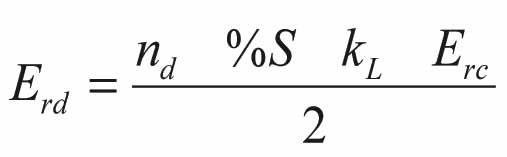
Where:
- nd is the number of trips per day (A trip is the movement from one floor to another.)
- %S is the percentage average travel distance per trip for a target installation.
- kL is the load factor per trip.
- Erc is the measured or estimated running energy consumption of the ISO reference cycle (two trips) in Wh.
- The number of trips per day (nd) for a target installation is either known, or can be estimated, or taken from Table 1. The number of trips defines the usage category for any calculations.
The percentage average travel distance (%S) can be taken from Table 2 based on the usage category selected and the number of possible stops in the served building.
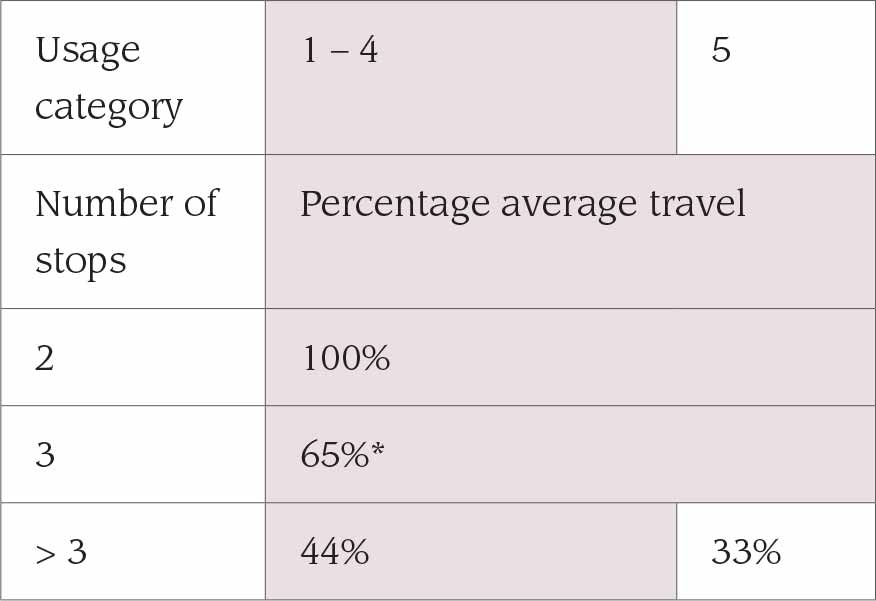
*The value suggested may need to be reviewed if the traffic movement between the two terminal floors is dominant. In this case, the average travel distance may tend toward 100%.
Note the number of stops for the target installation is known data.
The value for the load factor (kL) can be calculated using Equations 3a/3e below, where the value for percentage average car load (%Q) is taken from Table 3 according to the usage category and the rated load. Note the rated load (Q) of the target installation is known data.

For traction lifts counterbalanced to 50%:
kL = 1 – (%Q × 0.0164) (Equation 3a)
Range 0.97–0.74.
For traction lifts counterbalanced to 40%:
kL = 1 – (%Q × 0.0192) (Equation 3b)
Range 0.96–0.69.
For hydraulic lifts with no counterbalancing:
kL = 1 + (%Q × 0.0071) (Equation 3c)
Range 1.02–1.11.
For hydraulic lifts with 35% counterbalancing of the car weight:
kL = 1 + (%Q × 0.0100) (Equation 3d)
Range 1.02–1.16.
For hydraulic lifts with 70% counterbalancing of the car weight:
kL = 1 + (%Q × 0.0187) (Equation 3e)
Range 1.04–1.30.
The first three equations represent common traction and hydraulic lifts. The parameters given in these equations were developed from a computer model of a lift system. The range shown is for the lowest and highest %Q values in Table 3. It should be noted that a load in a traction lift reduces energy usage, and in a hydraulic lift, increases energy usage.
Estimated Daily Standing Energy Consumption
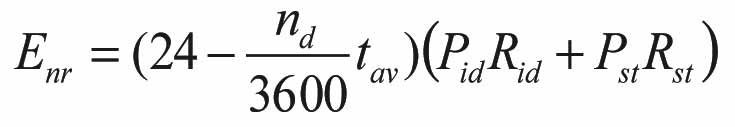
Where:
Pid is the power used when the lift is in idle mode (W)
(measured after door operations have ceased when
stopped at a landing).
Pst is the power used when the lift is in standby mode (W)
(measured after five minutes of inactivity).
Rid is the ratio of idle time when consuming Pid (value
< 1).
Rst is the ratio of standby time when consuming Pst
(value < 1).
tav is the time to travel the average travel distance for the
target installation, including door times (s).
Note the first term in Equation 4 is the time the lift is not running, i.e.: standing.
The idle power and the standby power are measured values obtained by the method given in EN ISO 25745-1: 2012. The idle power is measured with an empty car and when door operations have ceased. Standby power is measured after five minutes of inactivity.
The ISO method considers systems that may stay in a second standby mode up to 30 minutes. This not considered here.
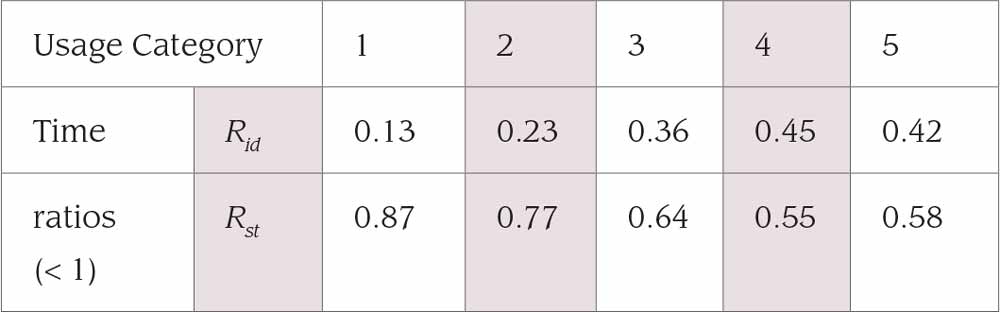
The values for Rid and Rst can be taken from Table 4. The time (tav) to travel the average distance (sav) is given by Equation 5:
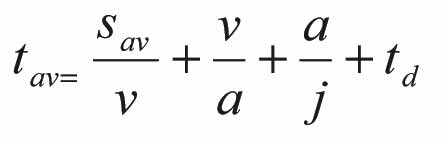
Where:
v is the rated speed (m/s).
j is the rated jerk (m/s2).
td is the time for the opening, opened and closing
times of the lift doors at the landings (s).
Examples
Example 1 – Traction Lift
The following example is from SAFE S24with rounded values for easier arithmetic.
Lift Parameters
- Traction lift in an office building
- Rated load: 1,500 kg
- Rated speed: 2.50 m/s
- Travel: 75 m
- Number of stops: 20
- Counterbalancing: 50%
- Acceleration: 1.0 m/s2
- Jerk 1.25 m/s3
- Door times: 8.0 s
Data Determined by Measurement or Simulation
- Daily trips: 750 (category 4)
- Idle power: 500 W
- Standby power after 5 minutes: 120 W
- ISO reference cycle energy: 170 Wh
Data from Tables
- Average travel distance: 44% (from Table 2)
- Average car load: 3.5% (from Table 3)
- Load factor (kL): 0.94 (from kL = 1 – (%Q × 0.0164))
- Idle/standby time ratio: 45/55 (from Table 4)
Calculation
sav = 0.44 × 75 = 33 m
tav = 33/2.5 + 2.5/1 + 1/1.25 + 8 = 24.5 s

= 5,500 Wh
Ed = 26,367 + 5,500 = 31,867 Wh
This is 32 kWh per day (about 0.6 p [0.6 c] per trip).
Example 2 — Hydraulic Lift
(This example is from SAFE S3 with rounded values for easier arithmetic.)
Lift Parameters
- Hydraulic lift in a residential building
- Rated load: 500 kg
- Rated speed: 0.6 m/s
- Travel: 13 m
- Number of stops: 5
- Counterbalancing: 0%
- Acceleration: 0.3 m/s2
- Jerk: 0.5 m/s3
- Door times: 8.0 s
Data Determined by Measurement or Simulation
- Daily trips: 30 (category 1)
- Idle power: 50 W
- Standby power after 5-minutes: 31 W
- ISO reference cycle energy: 91 Wh
Data from Tables
- Average travel distance: 44% (from Table 2)
- Average car load: 7.5% (from Table 3)
- Load factor (kL): 1.05 (from kL = 1 + [%Q × 0.0071])
- Idle/Standby time ratio: 13/87 (from Table 4)
Calculation

= 631Wh
sav = 0.44 × 13 = 5.7 m
tav = 5.7/0.6 + 0.6/0.3 + 0.3/0.5 + 8 = 20.1 s

= 797 Wh
Ed = 631 + 797 = 1,428 Wh
This is 1.4 kWh per day (about 0.7 p [0.7 c] per trip).
Warning
The figures given in Tables 2, 3 and 4 are based on the median values for the usage category. If the usage is discovered to be at the lower or higher end of a category, then using the median value may be inaccurate. Thus, if the actual number of trips is not close to the median, it is suggested that values are obtained from the tables by interpolation.
Acknowledgements
- ISO/TC178/WG10 for developing the method.
- The Task Group of WG10 for developing the load factor (kL).
- The tables contained in the standard were developed by Ana Lorente as part of her doctorate studies on her thesis “Life Cycle Analysis and Energy Modelling of Lifts” at the University of Zaragoza, Spain, in support of the work of WG10.[4]
References
[1] BS EN ISO 25745-1: 2012 Energy performance of lifts, escalators and moving walks Part 1: Energy measurement and verification.
[2] CIBSE Guide D: 2010.
[3] ISO/DIS 25745-2: 2013 Energy performance of lifts, escalators and moving walks Part 2: Energy calculation and classification for lifts (eleva-tors).
[4] Lorente, A-M, Nunez, J.L & Barney G.C.: “Energy models for lifts”; 2nd Symposium on Lift and Escalator Technologies, 27 September 2013, The University of Northampton
Get more of Elevator World. Sign up for our free e-newsletter.