Escalator Fractal Behavior, Part Four
Feb 1, 2021

Series conclusion details deployment of the concept of the fractal and its partial values in correlation to the mechanical performance and availability of escalators for passenger service.
The third part of this series[1] established that the behavior of an escalator with a mechanical defect can be quantified against the behavior of another escalator without a mechanical
defect. The concept of the fractal dimension (Df) was estimated to quantify the recoded data from the smart step in the two escalators.[3 & 4] This article dives deeper into the recorded traces in the previous study[1] by dividing the length of travel of the smart step inside the escalator into four regions. The Df value of each region has been determined, as when it was previously
established that the overall Df value is the product of the simple mathematical sum of the Df values of the individual regions.[5 & 6]
The study in this article reiterates the above fact again. Furthermore, it compares two operation scenarios for an escalator with and without a mechanical defect. The benefit behind establishing such a methodology is to help maintainers diagnose failure types quantitatively, as well as identify the location of the defect in the machine. These principles and fundamentals can be applied not only to escalators, but to any mechanical or electrical system.
Introduction
So far, using the smart step and the data from it, we have examined and es established the following:
- The smart step is an excellent detection tool for escalators that records and establishes the operation fingerprint of an escalator.[4]
- The data from the smart step are repeatable and consistent.[4]
- We have implemented the Df concept to quantify the mechanical behavior of an escalator.[5]
- The impact of passengers on the behavior of an escalator can be quantified using the Df concept.[5 & 6]
The length of travel of one cycle for the smart step in an escalator can be divided into individual regions. The Df of the overall behavior of a trace for an escalator is equal to the mathematical sum of the Df values of the individual regions of that escalator.
This article will reiterate points 4 and 5 by establishing that mechanical defects can be detected and quantified using the Df concept. Also, the overall Df value for an escalator with a mechanical defect is equal to the simple mathematical sum of the Df values of the individual regions in that escalator.
Methodology Used to Determine Df
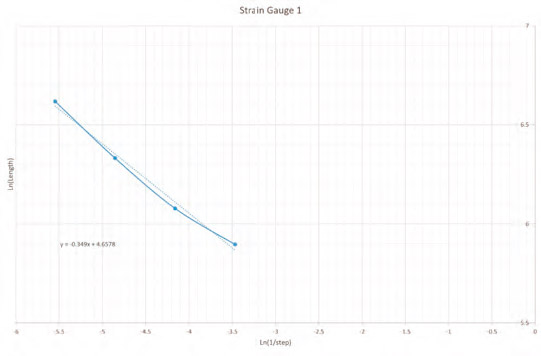
The scaling step technique was again used to determine Df. A computer program was written in Microsoft Excel to determine Df and plot the data. Our methodology is very similar to the Multiresolution Length Method, which has been used by many researchers.[7 & 9-12]
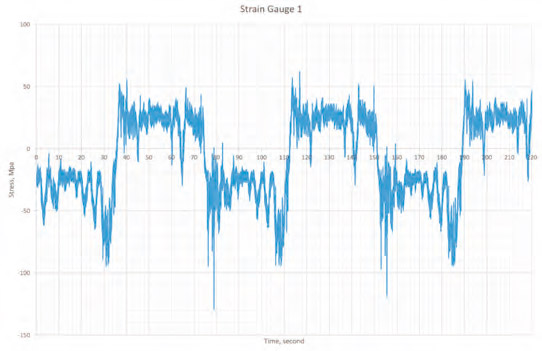
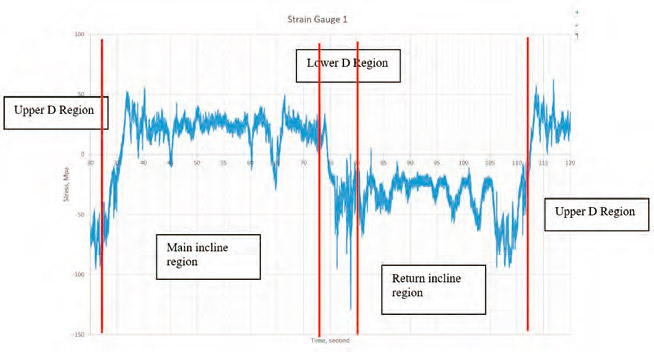
Part three of this series showed the data was collected from a smart step which has a strain gauge on each (left and right) side of the step. The step was run in two escalators, A and B. It was established that escalator A had a mechanical defect. Each trace for each strain gauge was divided into four regions (Figure 1):
- Upper D region
- Main incline region
- Lower D region
- Return incline
“D” is used to indicate the transition stages in the step band from the main to the return sides and from the return to the main side. Figure 2 shows how the trace from strain gauge 1, for example, was divided into the four regions. The Df value was calculated for each region.
Results and Discussion
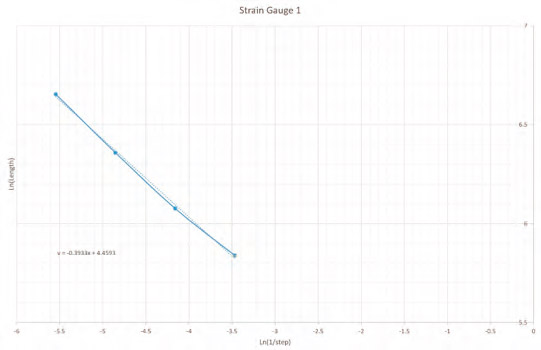
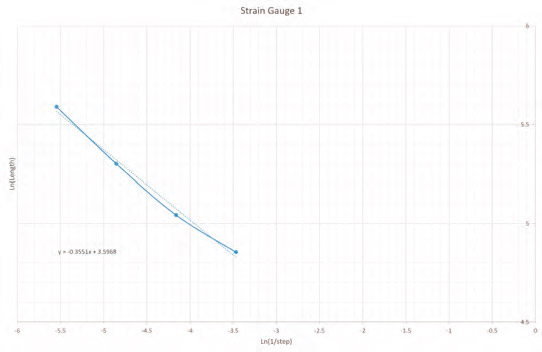
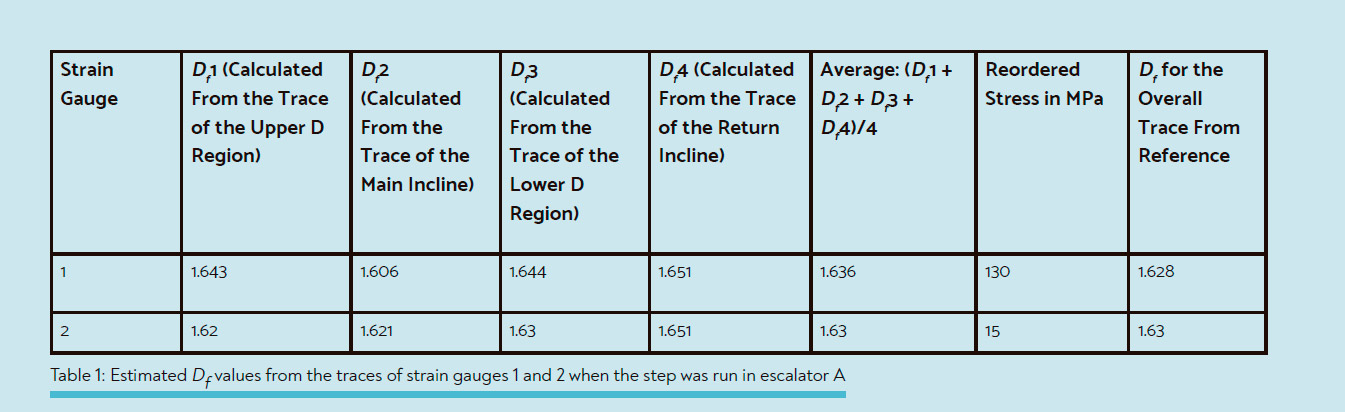
The Df values of all four divided regions were determined for the runs in escalators A and B (Figure 3) and listed in Tables 1 and 2. The results in Tables 1 and 2 confirm that the Df value for the overall trace of escalator A or B is equal to the simple mathematical sum of the Df values of the individual regions.
Comparing the Df values in Tables 1 and 2 shows that the estimated values produced from escalator A are higher than those produced from escalator B. The highest recorded Df value in Table 1 is in the return incline region. This finding agrees with our previous findings in part 3 and confirms the visual investigations we conducted on both escalators. Misalignment in the loading relieving ramps on the return side is the cause behind the increase in Df value.
Conclusions
An important conclusion can be drawn in this study: the partial Df values can be determined separately, and their quantities can be used to identify whether a machine like an escalator is free of defect. There is also a very good chance to correlate the Df values to the stress level, which is generated in the critical component of the step structure.


References
[1] A. Albadri. “Escalator Fractal Behavior, Part Three,” ELEVATOR WORLD, January 2021.
[2] A. Albadri. “Escalator Fractal Behavior, Part Two,” EW, December 2020.
[3] A. Albadri. “Tube Lines Gets Smart to Monitor Escalator Wear,” Computer Weekly (07/01/2008).
[4] A. Albadri. “Smart Step Measures Escalators’ Heartbeats,” EW, September 2020.
[5] A. Albadri. “Escalator Fractal Behavior, Part One,” EW, October 2020.
[6] J.D. Victor. “The Fractal Dimension of a Test Signal Impactions for System Identification Procedure, Biological Cybernetics 57, p. 421-426 (1987).
[7] Francis C. Moon. “Dynamics and Chaos in Manufacturing Processes,” Wiley Series in Nonlinear Science (1998).
[8] Athanasia Zlatintsi. “Multiscale Fractal Analysis of Musical Instrument Signals With Application to Recognition,” Institution of Electrical and Electronics Engineers (IEEE) Transactions of Audio Speech and Language Processing Vol. 21, No. 4, April 2013.
[9] Chang-Ting Shi. “Signal Pattern Recognition Based on Fractal Features and Machine Learning,” Applied Sciences 8, p. 1327 (2018).
[10] Dumitru Scheianu and Ion Tutanescu, University of Pitesti, Electronics, Communications and Computers Department.
[11] P. Marago and A. Potamianos. “Fractal Dimensions of Speech Sounds: Computation and Application to Automatic Speech Recognition,” Journal of Acoustical Society of America, No. 195 (3), March 1999.
[12] R.H. Riedi, M.S. Crouse, V.J. Ribeiro and R.G. Baraniuk. “A Multifractal Wave Model With Application to Network Traffic”, IEEE Transactions on Information Theory Vol. 45, No. 3, April 1999.

Get more of Elevator World. Sign up for our free e-newsletter.


