Your Lift Journey — How Long Will You Wait?
May 1, 2017

A study on passenger waiting time preferences yields interesting results.
by Caroline Bird, Dr. Richard Peters, Elizabeth Evans and Stefan Gerstenmeyer
When passengers start their lift journey, they initially wait for their call to be answered. While traveling to their destination, their trip is often interrupted by intermediate stops, which are the result of other passengers’ calls. Dispatching algorithms optimize the handling capacity and quality of service (QOS) of lift groups. The main criteria for QOS is currently average passenger waiting time (WT). Travel, overall journey time and number of stops are additional criteria. But, which is the most important for passengers when they think about their trip? How can dispatching algorithms be improved and tailored to meet passengers’ expectations? Your authors conducted an online questionnaire asking people how they feel while using lifts to help identify what passengers want and expect. The questions and results from the survey are presented here, and it is shown how the results can be applied to existing dispatching algorithms.
Criteria
The main criteria used to assess QOS in the lift industry is passenger WT. Many research papers show that long periods of waiting for a product or service lead to increased customer dissatisfaction.[1 & 2] However, there has been very little empirical research into the experience of waiting for and traveling in lifts.
When thinking about waiting in the context of lift usage, it is important not to think of it in isolation, but in conjunction with the overall lift journey. Most situations in which waiting is required tend to have a period of waiting for a product or service, followed by the end goal: the receipt of that product or service. Lift usage is relatively unique in that it comprises a waiting stage, an in-between period of traveling in the lift, then the end goal of reaching the destination. One of Maister’s key principles[3] is that occupied time feels shorter than unoccupied time. In the lift context, this suggests that traveling time feels shorter than WT.[4]
Dissatisfaction associated with waiting for a lift could also be due to the anxiety experienced. There are few indicators of how long the passenger will wait before the lift arrives. Once the lift arrives, anxiety reduces as the passenger is on the way to his or her destination.[5]
An important consideration in the psychology of waiting is that “waits must be appropriate,” both in cause and duration.[6] Customers are happy to wait for an appropriate amount of time, taking into account the situational factors. There is a limit to the amount of time passengers will wait and travel before they become impatient, which is dependent on individual factors.[7] In addition to waiting being an inevitable part of lift usage, they often deem a product or service to have an increased value if they have had to wait for it.[8] However, if a wait extends beyond what is deemed reasonable in the eyes of the customer, customer dissatisfaction will greatly increase.
There is a wide range of factors that could be studied in regards to the psychology of waiting in the context of lifts. This article focuses specifically on how overall journey times and intermediate stops affect passengers’ WT preference.
The definition of WT and other stages of the passenger journey are defined by CIBSE Guide D.[9] However, for interaction with the general public, less precise definitions are required. In this article, WT refers to the time from when the passenger enters the lobby until his or her lift has arrived. Travel time (TT) refers to any time from when the passenger enters the lift until arriving at his or her floor, including any intermediate stops (ISes). An IS occurs when the lift is stopped for other passengers to enter or exit the lift. Journey time (JT) is the sum of WT and TT.
Smith and Gerstenmeyer[4] posed the scenario in which a dispatcher had two journey options: both had identical overall JTs, but differing WTs and TTs. They concluded that the journey with the shorter WT mostly would be the preferred option. The authors questioned whether participants would be willing to make tradeoffs between WT and TT. For example, would passengers prefer a reduced overall JT at the expense of an increased WT?
The lift journey is often considered as comprising two parts: waiting and traveling, with traveling deemed as an occupied, anxiety-free portion of the journey. Barney and Dos Santos[10] observed that with increasing number of ISes, there is an increased level of frustration in passengers. This suggests that the travel portion of a lift journey ought to be considered in two parts, transit and stops, accounting for their different psychological impact.
The research used an online survey to reach the maximum number of participants with limited difficulty on the part of the participant. Animations were used throughout to present a realistic representation of the different parts of the lift journey, while removing the bias that would be present in live footage. As a principle of waiting is that emotions dominate,[6] the survey questions were designed to include emotive language, asking participants to focus on how they would feel experiencing a particular journey.
This survey presented participants with hypothetical journey scenarios, aiming to answer two main questions: “How do people feel about different parts of the lift journey?” and “What is the preferred period of time to wait for a lift, and how does this differ depending on the factors of overall JT and subsequent ISes? The research may be applied to improve the design of dispatching algorithms to account for QOS from the passengers’ prospective.
Methods
Participants
The use of an online survey ensured a quick data collection process. Data was collected anonymously from 278 participants; no personal details were collected. Participants were an opportunity sample who either received a link to the survey directly by email or were made aware of the survey on social media.
Materials and Procedure
The survey consisted of five questions, with the option to exit the survey after the first question. This was included to allow participants who were no longer interested in completing the survey to exit easily, while still allowing the retention of their data from the first question.
Question 1
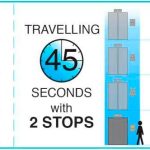
The first question had four parts. Each part included a basic animation depicting an aspect of a lift journey (waiting, traveling, first IS and second IS), along with four multiple-choice response options (Figure 1). Participants were asked how they felt at each part of the lift journey. Response options were four animated faces: a green smiley face, a yellow semi-smiley face, an orange semi-sad face and a red sad face, scored 1-4, respectively. The aim of this question was to ascertain an easily comparable rating system for how happy participants are to experience each aspect of the lift journey, relative to other aspects.
Question 2
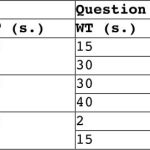
This question aimed to assess participants’ preferred WT. Participants were provided with three theoretical journeys. All journeys had the same overall JT, but with different WTs and TTs (Table 1). The options were presented in the format given in Figure 2.
Question 3
Participants were provided with a different version of question 3, depending on their answer to question 2. They were presented with two theoretical journeys in the same format as the previous question. The first journey was identical to their answer to question 2. The second hypothetical journey consisted of a longer WT but a shorter overall JT (Table 2). We knew from question 2 that participants were happy to wait for their chosen length of time. By including this manipulation, it allowed an analysis of whether participants are willing to increase their WT to achieve shorter JT.
Question 5
This final question was another assessment of WT versus TT using a Likert scale with considering “relative lengths,” rather than providing participants with specific timings for a theoretical journey. See Figure 4 for a presentation of the possible answers. The results of this question provide a specific ratio of preferred WT to TT.
Analysis and Results
Question 1
The independent variable was “part of the journey” with four levels: waiting, traveling, first IS and second IS. The dependent variables were the smiley-face ratings scored 1-4 (happy-sad). A Friedman test was used due to the repeated measures design and nonparametric ordinal data. This was supplemented with Bonferroni-corrected Wilcoxon signed-rank tests.
The Friedman test found there was a significant difference in how people felt about the different parts of the journey, x2(3) = 453.11 and p < 0.001 (Figure 5). Traveling in the lift received the lowest rating, followed by waiting, first IS and second IS. Post-hoc Wilcoxon signed-rank tests ( α = .008) showed a significant difference between all conditions (Table 4).
Question 2
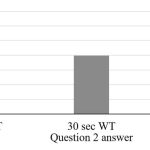
There were three possible answers to this question: 15-s. WT, 30-s. WT and 2-s. WT. Therefore, a one-sample t-test testing for a significant difference in the journey chosen was used. There was a significant difference in the journey chosen (t(256) = 39.69, p < 0.001 and M = 1.69), with significantly fewer people choosing a 2-s. WT (13%) and the same number opting for both a 15-s. WT (44%) and 30-s. WT (44%).
Question 3
There were three different versions of Question 3 depending on the response participants gave to Question 2. One sample of t-tests was used for each of the versions.
Question 3a
Participants could opt to stay with a 15-s. WT but overall 60-s. JT, or change their preferred lift journey to 30-s. WT but overall 50-s. JT. Significantly more participants opted to stay with a 15-s. WT (67.57%) than change to a 30-s. WT (32.43%; t(110) = 29.67 and p < 0.001).
Question 3b
Participants could stay with a 30-s. WT and 60-s. JT, or change their preferred lift journey to 40-s. TT and 50-s. JT. Significantly more participants stayed with the same JT with a 30-s. WT (52.34%) than changed to a 40-s. WT (47.66%; t(110) = 31.02 and p < 0.001).
Question 3c
Participants were presented with the option of staying with a 2-s. WT and 60-s. JT or choosing a longer WT of 15 s., but shorter 50-s. JT. Significantly more participants opted to change to a 15-s. WT (53.33%) than stay with a 2-s. WT (46.67%; t(30) = 17.04 and p < 0.001).
Question 4
To ascertain the relative impact of number of ISes on WT, answers from question 2 became the independent variable in this analysis. This, therefore, contained three levels: 15-, 30- and 2-s. WT. The dependent variable was the number of stops, chosen from zero to four, scored 1-4, respectively.
Due to the independent measures design and nonparametric ordinal data, a Kruskal Willis test was used. This test found a significant difference in preference for ISes in participants’ journeys, dependent on their preferred WTs as ascertained in Question 2: 2(2) = 20.20 and p < 0.001 (Figure 7). Participants who chose in Question 2 to have either a 15- or 30-s. WT opted for a journey with a 30-s. WT but only one IS. Participants who chose a 2-s. WT in Question 2 opted for a journey with a 15-s. WT and 2 ISes.
Question 5
This question consisted of a Likert scale with nine response options ranging from: less time waiting than traveling (scored 1), through to equal time waiting and traveling (scored 5) and through to more time waiting than traveling (scored 9). Participants’ data provided a mean score of 3.96.
Discussion
Question 1: Feelings at Different Parts of the Journey
Participants gave traveling the highest happiness rating, followed by waiting, which was one step down on the scale, but still indicated a positive feeling. This supports previous research that traveling is more desirable than waiting due to the reduction in anxiety once the passenger is in the lift.[4 & 5] It also supports Norman’s[6] principle: if waits are appropriate and reasonable, passengers are happy to experience them.
Participants were less happy experiencing ISes than waiting, indicating a negative feeling for both ISes. The negative feeling increased from the first to the second IS. These findings can provide empirical support for the observations made by Barney and Dos Santos[10] that passenger’s frustration level increased with the number of ISs they experienced. In dispatching decisions, Maister’s principle that “occupied time feels shorter than unoccupied time” should not be interpreted to assume that the delay associated with ISes is occupied time.
Question 2: Preferred WT
Participants were initially presented with three different hypothetical journeys. Thirteen percent of the participants opted for a journey with only a 2-s. WT, with the rest of the participants split evenly between choosing the 15- and 30-s. WT. The most interesting point of note from these results is the varied responses, with no preference shown for one WT over another. This supports the idea that “waits ought to be appropriate”[6] but suggests people have different interpretations of “appropriate.”
Question 3: Wait Longer for Shorter Arrival?
The aim of this question was to assess whether the benefit of a shorter overall JT was good enough to warrant an increase in the more negatively perceived WT. The survey found that the two groups of participants who previously chose to have a WT of either 15 or 30 s. opted to stay with their original choice, rather than chose the alternative shorter journey. In contrast, of the few participants who originally chose a 2-s. WT, a significant, but small majority of participants chose, instead, to have a shorter overall JT at the expense of an increased WT. For them, an increase in that WT still provided an “appropriate” WT with the added benefit of a reduced JT. For participants who had already chosen a substantial WT of either 15 or 30 s., the benefit of a reduced JT was not enough to encourage them to endure an increased, negative waiting period.
Question 4: Intermediate Stops?
Participants who initially chose (prior to the follow-up JT question) to have a WT of 30 s. went on to choose an IS journey with one stop, and a 30-s. WT. Participants who had chosen a WT of 15 s. in Question 2 thus increased this to a WT of 30 s. and only one IS, as opposed to two ISes if they remained with a 15 second WT. A reduction in overall JT was not incentive enough to encourage this group of participants to increase their WT, whereas a reduction in the number of ISes was. This suggests that ISes provide a more negative experience than waiting.
Participants who originally chose a WT of 2 s. chose to increase their WT to 15 s. to reduce the number of ISes from four to two. This affirms that passengers’ preferences are not best served by simply considering WT.
Question 5: Waiting Time Versus Traveling Time
The structure of this question allowed for proportional data to be collected on WT preferences, as opposed to the fixed timings seen in the previous questions. Previous work suggested a rule of thumb that WTs could be a quarter of the total journey.[11] The results from this question suggest passengers would prefer nearer a third of overall JT waiting. This is also reflected in the results from the other questions, in which 44% of participants preferred to spend a quarter of the time waiting, and 44% preferred to spend half of the time waiting.
Limitations
While steps were taken to ensure the validity of results, all surveys have limitations. The first is in regards to the ecological validity of the survey. Despite the use of animation to create a virtual lift journey experience for the participants and the use of emotive language to encourage the correct frame of mind for the participants, answering questions on the survey is not the same as experiencing an actual lift journey.
Levinson[12] carried out a study on waiting and traveling in the context of driving. Half the participants were given a set of scenarios via a computer-survey format, and the other half experienced the scenarios in a driving simulator. Levinson found significantly different results depending on the participants’ situation. Other research has also found that time is often perceived as passing differently than it actually passes[2] and that the extent to which perceived time differs from reality is conditional on whether the participant is waiting or traveling.[13]
The second limitation of this study is the applicability of the results to dispatch systems’ operations in their current form. Participants were presented with all lift-journey options and then allowed time to make the decision about which journey they would prefer. At present, this is not an option afforded to lift passengers. Therefore, while a passenger may prefer a journey with a longer WT, because it is a direct journey with no ISes, the passenger would not know this information at the time of waiting for his or her lift. That passenger would simply experience an increased WT, without explanation, and therefore would be experiencing negative emotions and a poorer QOS.[5] This is seen in a study by Van Houton[14] in which a lift was programmed to have an increased door delay, extending both WT and TT. It was found that when the door delay was increased, significantly more participants opted to take the stairs, instead of experience the unexplained increased wait. Providing passengers with information regarding their WT could not only reduce confusion, but also increase the perceived QOS.[6]
QOS Dispatching
The principle of considering passengers’ perception is already built into some dispatch algorithms. A combination of QOS criteria can be considered by weighting individual components to create a pain index.[11] This provides the basis for QOS dispatching, optimizing dispatching choices based on our best understanding of passenger preferences.
Waits ought to be appropriate.[6] However, the survey responses affirm that WT alone should not be used as a proxy for QOS. This research provides empirical data on which to base the weighting of WT and TT. TT includes periods of unoccupied time during ISes. To improve perceived performance with QOS dispatching, the passenger delay associated with ISes needs to be accounted for separately.
While participants’ feelings towards ISes was studied, similar studies and assumptions can also be made regarding other lift journey delays. For example:
- False stops, which occur when passengers endure an IS without a passenger joining or alighting the lift.
- In systems with more than one cabin or lift per shaft, there are periods when passengers experience delay while other unseen passengers are joining or alighting another cabin or lift.[4]
- Cases in which the best dispatching compromise is to load a passenger while traveling in the opposite direction to their destination, resulting in a reverse journey.[15]
QOS dispatching will benefit from the best possible communication with passengers. An unexplained pause in lift operation or an unexpected reverse journey leads to confusion and mistrust.
Current dispatchers do not reflect the wide range of preferences reflected in the survey results. It is conceivable that personal preferences could be collected with a smartphone app and accounted for in dispatching decisions. The app could also support supplementary communication with the passenger.
Conclusion
The findings in this research confirm the principle of appropriate WTs[6] but suggest that the concept of “appropriate” may vary greatly for different passengers. They also suggest that the traveling part of a lift journey should not be considered as one section alone, but instead as a section containing multiple parts to account for the unoccupied times of stopping interspersed within the traveling. The reduction in ISes is more motivating than a reduction in overall JT to increase WTs.
The application of the research through QOS dispatching has been discussed. In addition to choosing an appropriate optimization function, the best possible communication with passengers has been highlighted as a priority to improve passenger perception.
Areas for future research include evaluating how people feel about other lift-journey delays, such as false stops, pauses in operation due to another cabin or car sharing the same shaft, and reverse journeys.
-

- Figure 1: Presentation of question 1, part 1 with multiplechoice response options
-

- Figure 2: Format of hypothetical journeys in questions 2 and 3
-
- Figure 3: Format of hypothetical journeys in Question 4
-

- Figure 4: Format of possible answers to Question 5
-
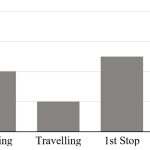
- Figure 5: Median happiness score for each part of the journey
-
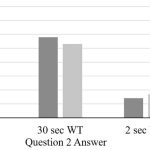
- Figure 6: Number of participants who chose each journey dependent on WT preference in Question 2
-
- Figure 7: Median score of IS preference dependent on WT preference in Question 2
-
- Table 1: Question 2: hypothetical journey options
-
- Table 2: Hypothetical journey options in question 3
-
- Table 3: Hypothetical journey options in Question 4, with times presented in s.
-

- Table 4: Post-hoc Wilcoxon signed-rank tests
References
[1] Zhou, R. and Soman, D. “Consumers’ Waiting in Queues: The Role of First-Order and Second-Order Justice.” Psychology and Marketing. 25 (3), 262-279 (2008).
[2] Houston, M.B.; Bettencourt, L.A.; and Wenger, S. “The Relationship Between Waiting in a Service Queue and Evaluations of Service Quality: A Field Theory Perspective.” Psychology and Marketing. 15 (8), 735-753 (1998).
[3] Maister, D. “The Psychology of Waiting Lines” (1985) (davidmaister.com/articles/the-psychology-of-waiting-lines, accessed February 12, 2014).
[4] Smith, R. and Gerstenmeyer, S. “A Review of Waiting Time, Journey Time and QOS.” Presented at Symposium on Lift and Escalator Technologies, Northampton, U.K. (2013).
[5] Hui, M.K. and Tse, D.K. “What to Tell Consumers in Waits of Different Lengths: An Integrative Model of Service Evaluation.” Journal of Marketing. 60 (2), 81-90 (1996).
[6] Norman, D. “The Psychology of Waiting Lines” (2008) (www.jnd.org/dn.mss/the_psychology_of_waiting_lines.html, accessed May 7, 2014).
[7] Strakosch, G. and Caporale, R.S. The Vertical Transportation Handbook, Fourth Edition. Hoboken; New Jersey: John Wiley & Sons, Inc. (2010).
[8] Koo, M. and Fishbach, A. “A Silver Lining of Standing in Line: Queuing Increases Value of Products.” Journal of Marketing Research. 47 (4), 713-724 (2010).
[9] The Chartered Institution of Building Services Engineers (CIBSE). CIBSE Guide D: 2015 Transportation Systems in Buildings. London (2015).
[10] Barney, G. and Dos Santos, S. Lift Traffic Analysis Design and Control. London: Pereginus (1977).
[11] Smith, R. and Peters, R. “Enhancements to the ETD Dispatcher Algorithm.” Elevator Technology 14: Proceedings of Elevcon 2004. The International Association of Elevator Engineers (2004).
[12] Levinson, D.; Harder, K.; Bloomfield, J.; Winiarczyk, K.; Levinson, D.D.; Engineering, D.O.C.; and Harder, K. “Weighting Waiting Evaluating Perception of In-Vehicle Travel Time Under Moving and Stopped Conditions.” Transportation Research Record Journal of the Transportation Research. 1898, 61-68 (2004).
[13] Zhang, L.; Xie, F.; and Levinson, D. “Illusion of Motion.” Transportation Research Record: Journal of the Transportation Research Board. 2135, 34-42 (2009).
[14] Houten, R.V.; Nau, P. A.; and Merrigan, M. “Reducing Elevator Energy Use: A Comparison of Posted Feedback and Reduced Elevator Convenience.” Journal of Applied Behavior Analysis. 14 (4), 377-387 (1981).
[15] Gerstenmeyer, S. and Peters, R. “Reverse Journeys and Destination Control” presented at Symposium on Lift and Escalator Technologies, Northampton, U.K. (2014).
Get more of Elevator World. Sign up for our free e-newsletter.


